2025 AP Microeconomics Free-Response Questions
Advanced PlacementAP MicroeconomicsEconomicsFree Response
3 questions20 pts
3 gradable20 rubric criteria0 dependencies
q1Question 1
q1
Question 1
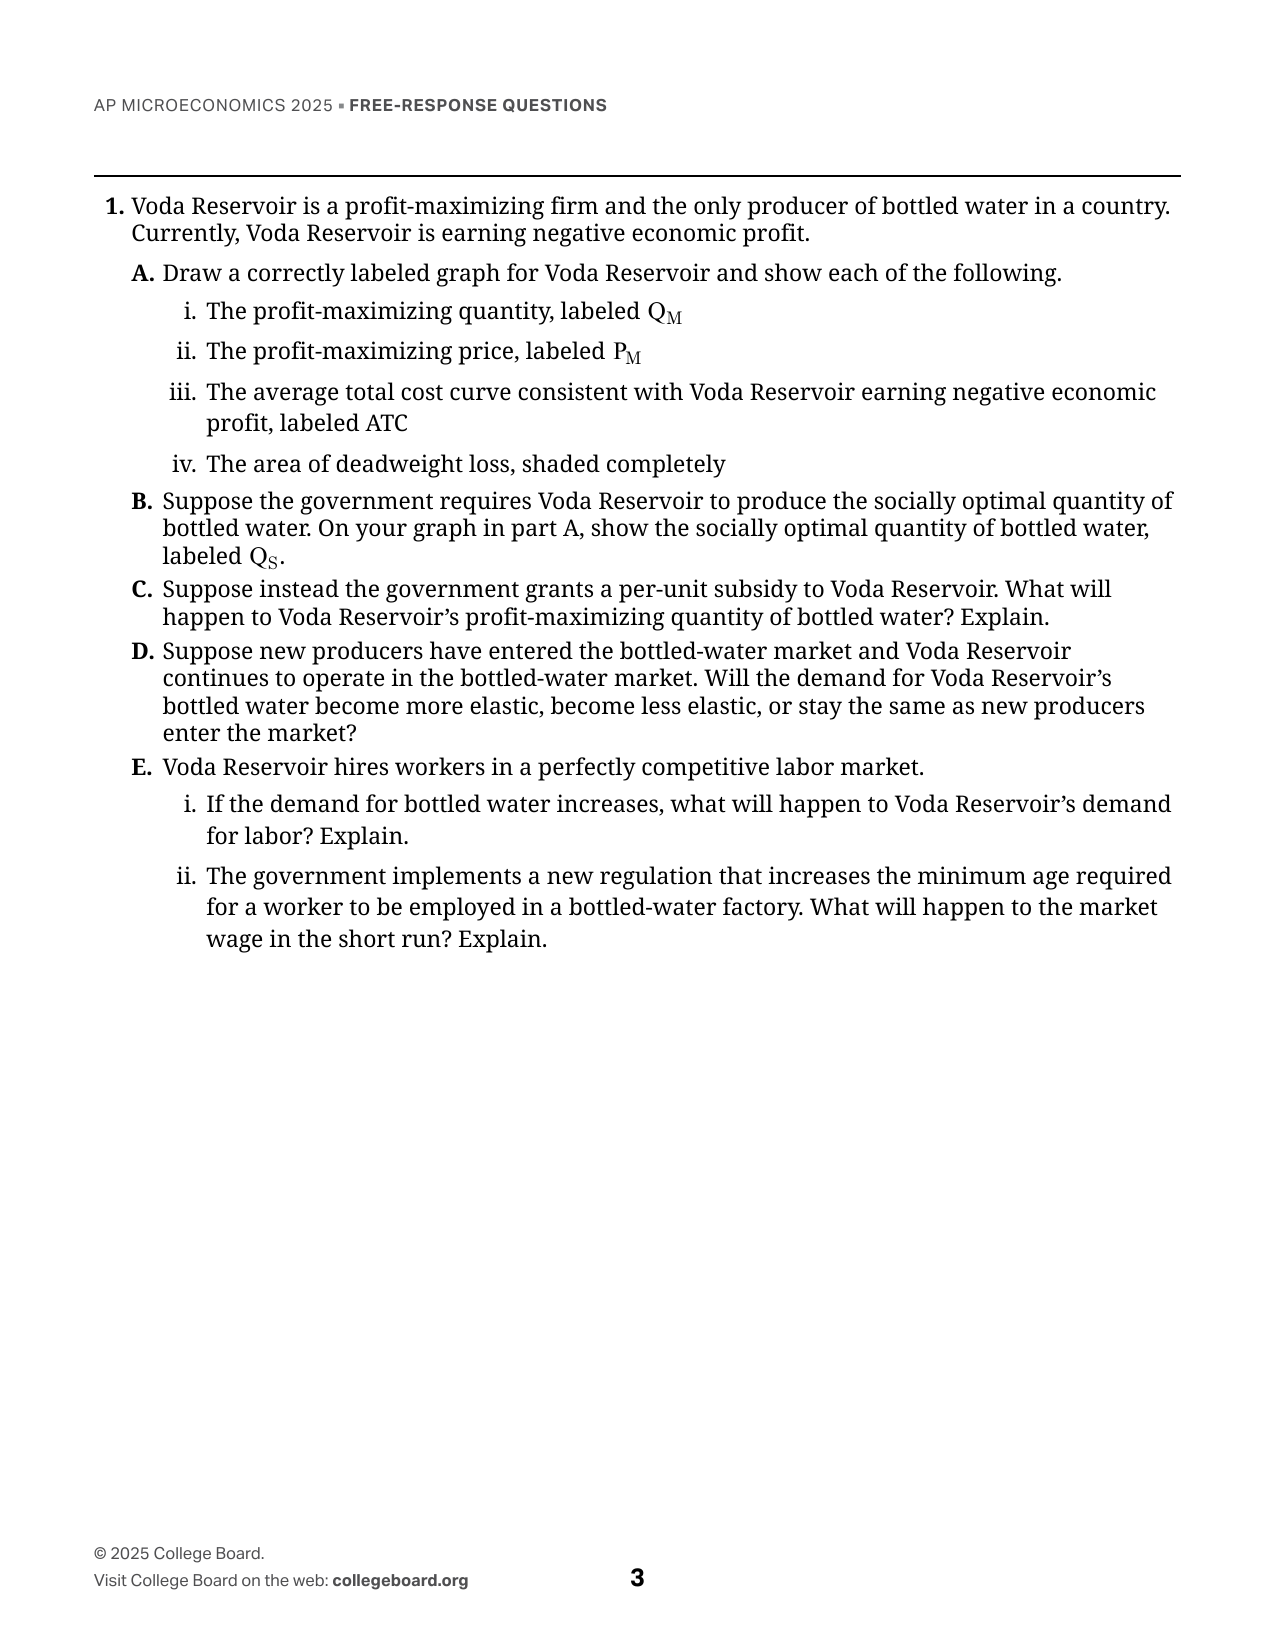
1. Voda Reservoir is a profit-maximizing firm and the only producer of bottled water in a country. Currently, Voda Reservoir is earning negative economic profit. A. Draw a correctly labeled graph for Voda Reservoir and show each of the following. i. The profit-maximizing quantity, labeled QM ii. The profit-maximizing price, labeled PM iii. The average total cost curve consistent with Voda Reservoir earning negative economic profit, labeled ATC iv. The area of deadweight loss, shaded completely B. Suppose the government requires Voda Reservoir to produce the socially optimal quantity of bottled water. On your graph in part A, show the socially optimal quantity of bottled water, labeled QS. C. Suppose instead the government grants a per-unit subsidy to Voda Reservoir. What will happen to Voda Reservoir's profit-maximizing quantity of bottled water? Explain. D. Suppose new producers have entered the bottled-water market and Voda Reservoir continues to operate in the bottled-water market. Will the demand for Voda Reservoir's bottled water become more elastic, become less elastic, or stay the same as new producers enter the market? E. Voda Reservoir hires workers in a perfectly competitive labor market. i. If the demand for bottled water increases, what will happen to Voda Reservoir's demand for labor? Explain. ii. The government implements a new regulation that increases the minimum age required for a worker to be employed in a bottled-water factory. What will happen to the market wage in the short run? Explain.
Rubric Criteria (10)
Point_1Draw a correctly labeled graph for Voda Reservoir with a downward-sloping demand (D) curve and a downward-sloping marginal revenue (MR) curve with the MR curve below the D curve.
1.0000pts
Point_2The graph must show a rising marginal cost (MC) curve and the profit-maximizing quantity, labeled QM, where MR = MC.
1.0000pts
Point_3The graph must show the profit-maximizing price, labeled PM, from the D curve at QM.
1.0000pts
Point_4The graph must show the average total cost (ATC) curve above the D curve and show the MC curve passing through the minimum point of the ATC curve.
1.0000pts
Point_5The graph must show the area of deadweight loss, shaded completely.
1.0000pts
Point_6The graph from part A must show the socially optimal quantity of bottled water, labeled QS, from the intersection of the D and MC curves.
1.0000pts
Point_7State that Voda Reservoir’s profit-maximizing quantity of bottled water will increase and explain with ONE of the following: the per-unit subsidy decreases the firm’s marginal cost, which shifts the MC curve to the right (down), intersecting the MR curve at a greater quantity; OR the per-unit subsidy increases the firm’s marginal revenue, which shifts the MR curve to the right, intersecting the MC curve at a greater quantity.
1.0000pts
Point_8State that the demand for Voda Reservoir’s bottled water will become more elastic.
1.0000pts
Point_9State that Voda Reservoir’s demand for labor will increase and explain that the increase in demand for bottled water will increase the price and marginal revenue of bottled water, increasing the marginal revenue product of labor.
1.0000pts
Point_10State that the market wage will increase in the short run and explain that the new regulation will decrease the supply of workers.
1.0000pts
Dependencies (0)
Page Mapping (1)
Visual Preview
12 boxes
Draw, drag, resize. Advanced coordinates are available if needed.
1
2
3
4
5
6
7
8
9
10
11
12
Select a box to edit its role and metadata.
Attribution
This material is the intellectual property of College Board, is not owned by GradeThis, and is shown here for ease of use and demonstration purposes.