2025 AP Statistics Free-Response Questions
Advanced PlacementAP StatisticsFree ResponseMathematics
6 questions24 pts
6 gradable6 rubric criteria0 dependencies
q1Question 1
q1
Question 1
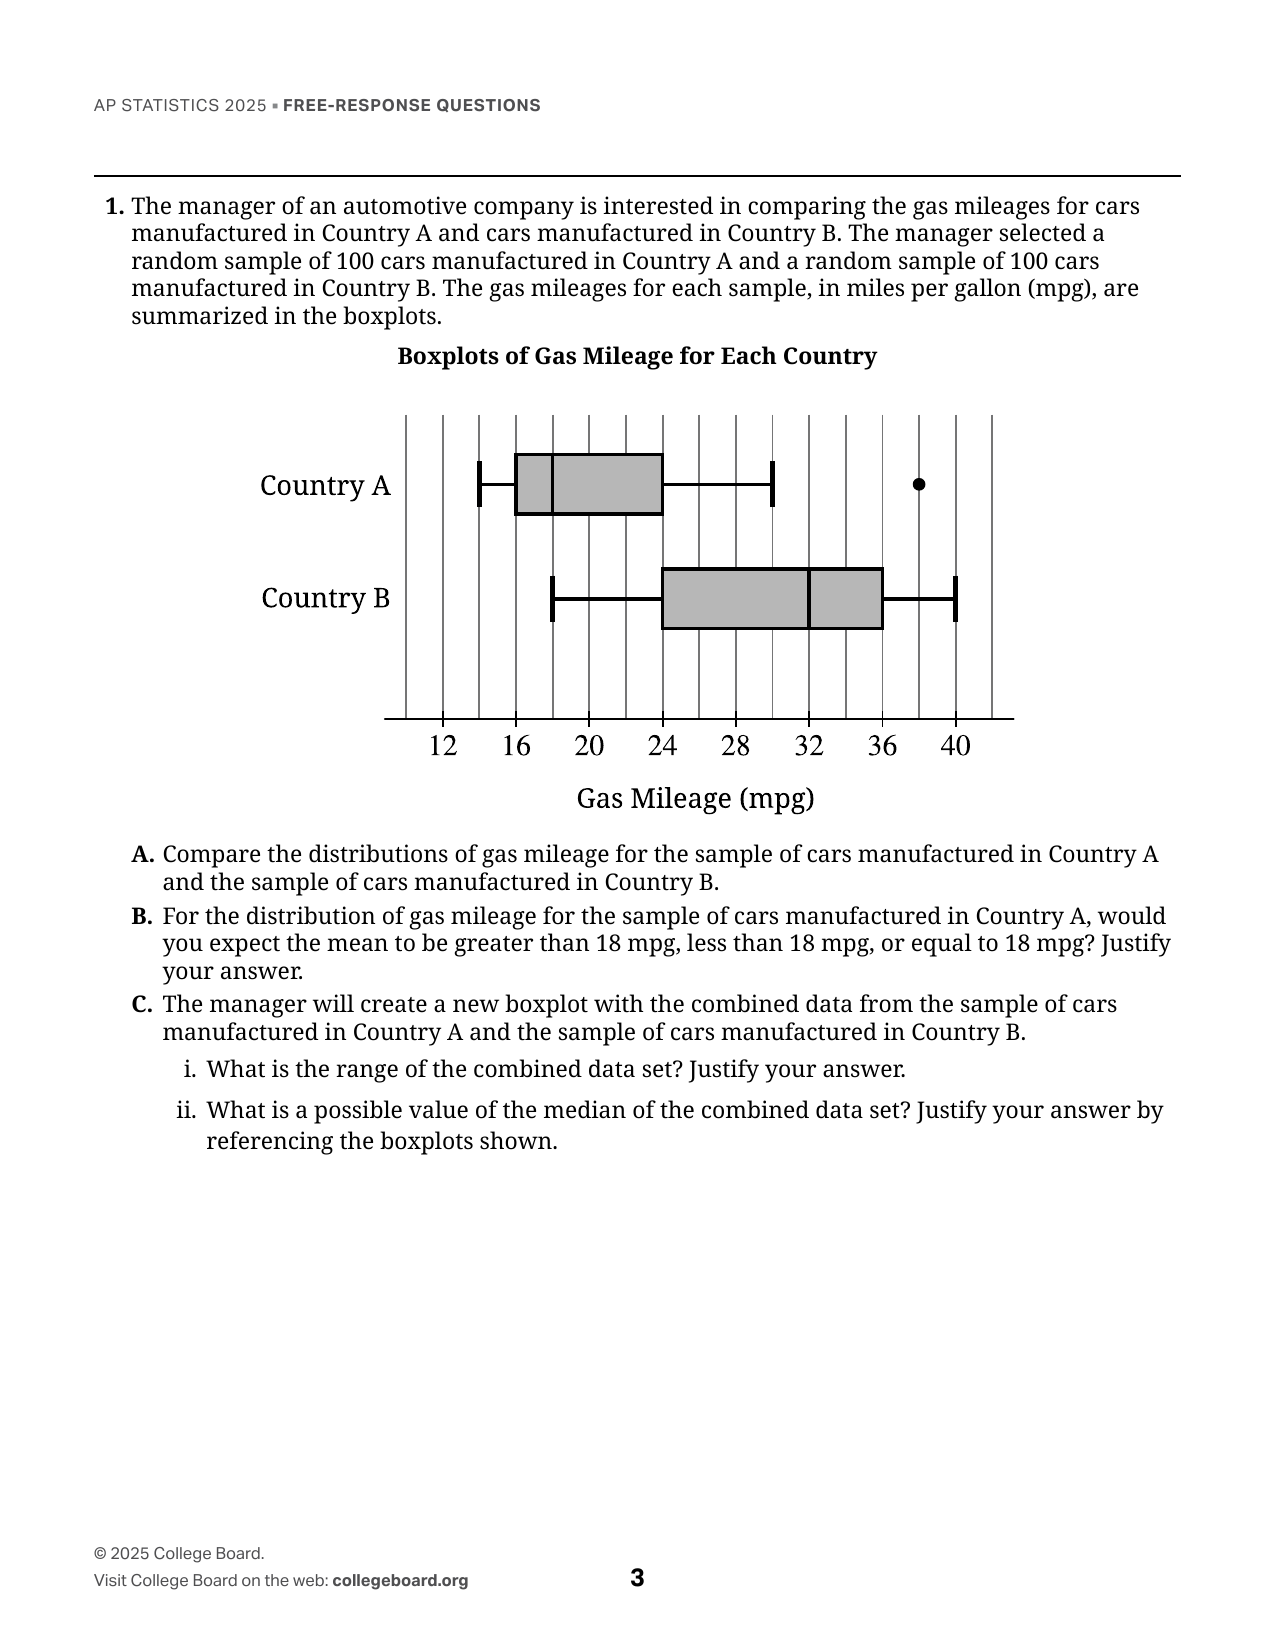
1. The manager of an automotive company is interested in comparing the gas mileages for cars manufactured in Country A and cars manufactured in Country B. The manager selected a random sample of 100 cars manufactured in Country A and a random sample of 100 cars manufactured in Country B. The gas mileages for each sample, in miles per gallon (mpg), are summarized in the boxplots. Boxplots of Gas Mileage for Each Country A. Compare the distributions of gas mileage for the sample of cars manufactured in Country A and the sample of cars manufactured in Country B. B. For the distribution of gas mileage for the sample of cars manufactured in Country A, would you expect the mean to be greater than 18 mpg, less than 18 mpg, or equal to 18 mpg? Justify your answer. C. The manager will create a new boxplot with the combined data from the sample of cars manufactured in Country A and the sample of cars manufactured in Country B. i. What is the range of the combined data set? Justify your answer. ii. What is a possible value of the median of the combined data set? Justify your answer by referencing the boxplots shown.
Rubric Criteria (1)
C1This question is scored holistically. Part A is Essentially Correct (E) if the response satisfies at least three of four components: (1) directly compares the center for the two distributions, (2) directly compares the spread (IQR or range) for the two distributions, (3) indicates that the gas mileage of one of the cars manufactured in Country A is an outlier, (4) provides sufficient context including the manufacturing countries (“Country A” and “Country B”) and the dependent variable (“gas mileage” or “mpg”). Part A is Partially Correct (P) if exactly two components are satisfied; otherwise Incorrect (I). Part B is E if three components are satisfied: (1) indicates that the mean of the distribution of gas mileage for the sample of cars manufactured in Country A is expected to be greater than 18 mpg, (2) indicates 18 as the value of the median, (3) provides reasonable justification for the relationship between the mean and the median based on a right-skewed distribution or the expectation that an outlier in the right tail will pull the mean above the median. Part B is P if component 1 and either component 2 or 3 are satisfied; otherwise I. Part C is E if four components are satisfied: (1) correctly calculates 26 mpg as the range of the combined data set, (2) provides justification for the range by identifying 40 as the maximum and 14 as the minimum of the combined data set, (3) calculates 24 mpg as a possible value of the median of the combined data set, (4) provides justification for the median by indicating that at least half of the combined data values are at most 24 and at least half are at least 24. Part C is P if two or three components are satisfied; otherwise I. Final conversion: award 4 points for Complete Response (three parts E); 3 points for Substantial Response (two parts E and one part P); 2 points for Developing Response (two parts E and no part P, or one part E and one or two parts P, or three parts P); 1 point for Minimal Response (one part E and no parts P, or no part E and two parts P); otherwise 0 points.
4.0000pts
Dependencies (0)
Page Mapping (1)
Visual Preview
8 boxes
Draw, drag, resize. Advanced coordinates are available if needed.
1
2
3
4
5
6
7
8
Select a box to edit its role and metadata.
Attribution
This material is the intellectual property of College Board, is not owned by GradeThis, and is shown here for ease of use and demonstration purposes.