2024 AP Microeconomics Free-Response Questions
Advanced PlacementAP MicroeconomicsEconomicsFree Response
3 questions20 pts
3 gradable20 rubric criteria0 dependencies
q1Question 1
q1
Question 1
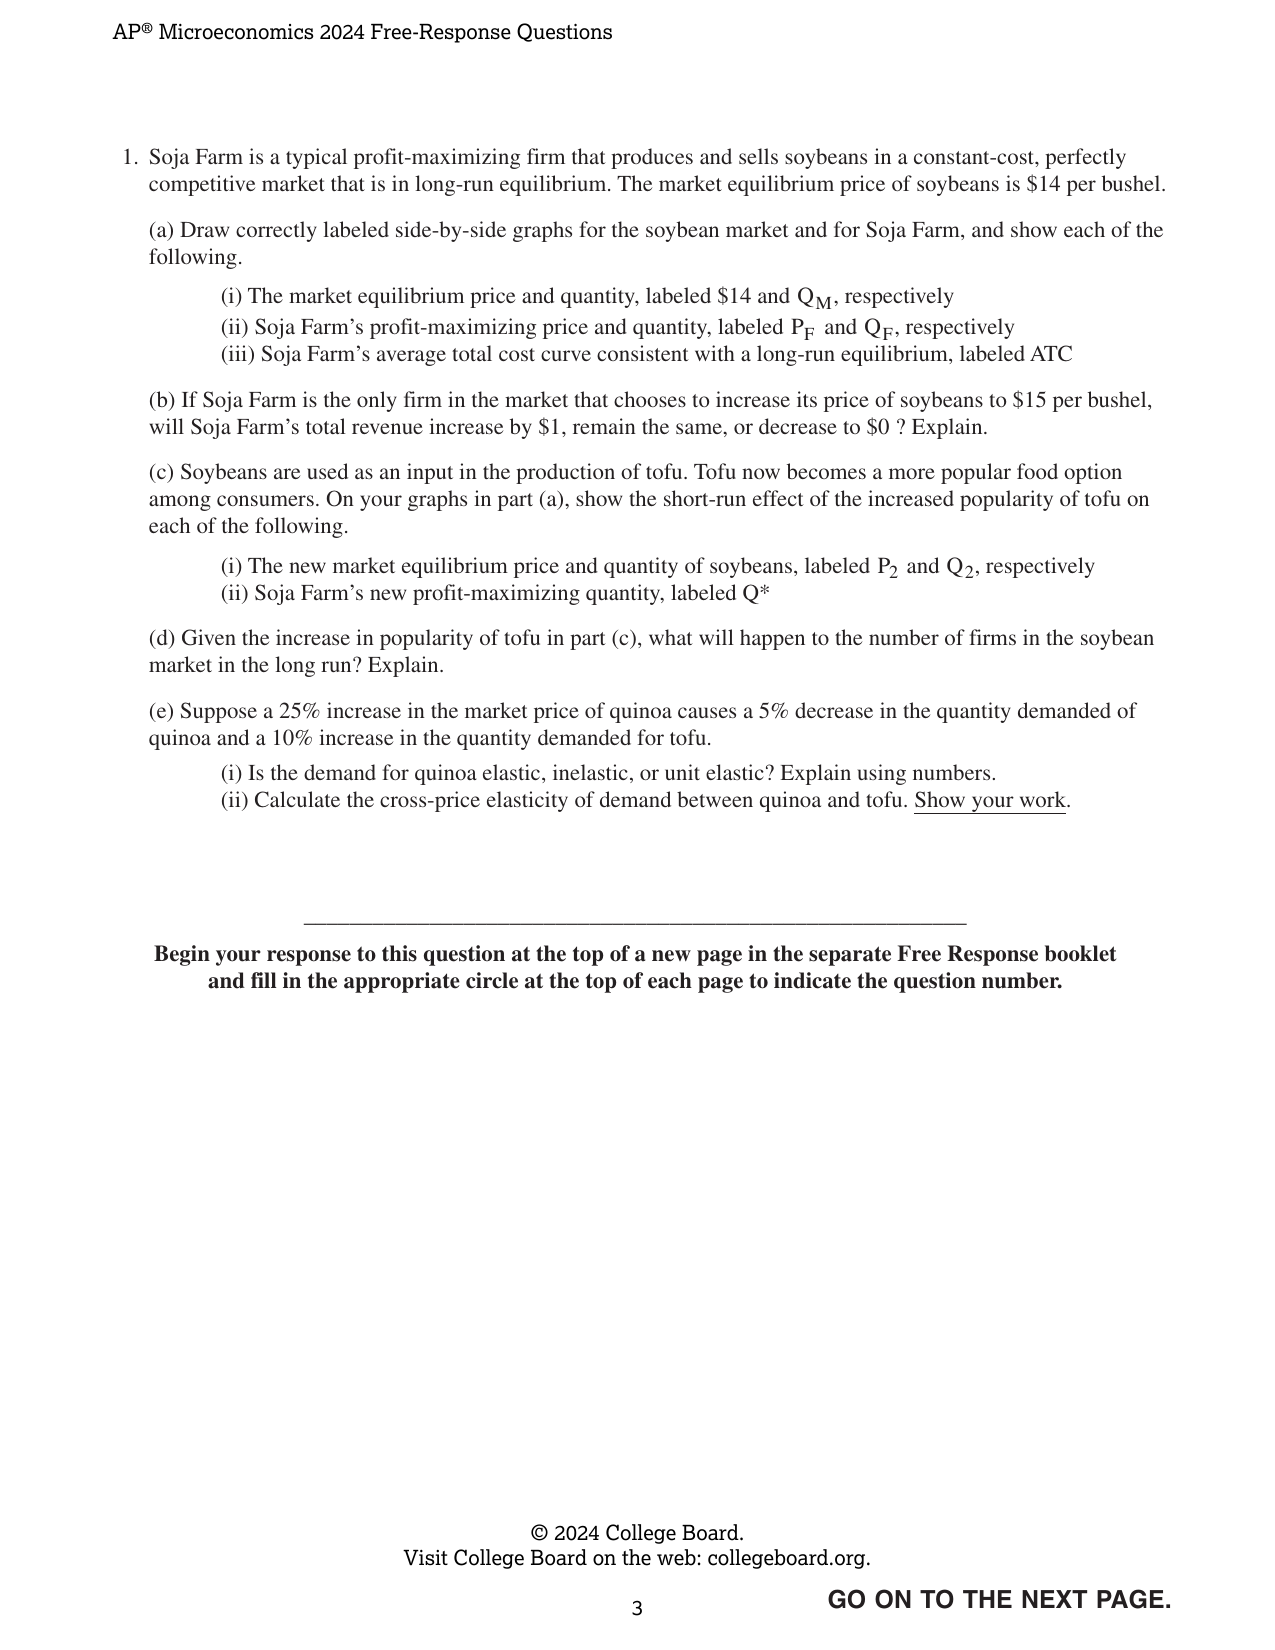
1. Soja Farm is a typical profit-maximizing firm that produces and sells soybeans in a constant-cost, perfectly competitive market that is in long-run equilibrium. The market equilibrium price of soybeans is $14 per bushel. (a) Draw correctly labeled side-by-side graphs for the soybean market and for Soja Farm, and show each of the following. (i) The market equilibrium price and quantity, labeled $14 and Q_M, respectively (ii) Soja Farm's profit-maximizing price and quantity, labeled P_F and Q_F, respectively (iii) Soja Farm's average total cost curve consistent with a long-run equilibrium, labeled ATC (b) If Soja Farm is the only firm in the market that chooses to increase its price of soybeans to $15 per bushel, will Soja Farm's total revenue increase by $1, remain the same, or decrease to $0 ? Explain. (c) Soybeans are used as an input in the production of tofu. Tofu now becomes a more popular food option among consumers. On your graphs in part (a), show the short-run effect of the increased popularity of tofu on each of the following. (i) The new market equilibrium price and quantity of soybeans, labeled P_2 and Q_2, respectively (ii) Soja Farm's new profit-maximizing quantity, labeled Q* (d) Given the increase in popularity of tofu in part (c), what will happen to the number of firms in the soybean market in the long run? Explain. (e) Suppose a 25% increase in the market price of quinoa causes a 5% decrease in the quantity demanded of quinoa and a 10% increase in the quantity demanded for tofu. (i) Is the demand for quinoa elastic, inelastic, or unit elastic? Explain using numbers. (ii) Calculate the cross-price elasticity of demand between quinoa and tofu. Show your work. Begin your response to this question at the top of a new page in the separate Free Response booklet and fill in the appropriate circle at the top of each page to indicate the question number.
Rubric Criteria (10)
C1The response includes a correctly labeled graph of the market for soybeans showing a downward-sloping demand curve labeled D1 and an upward-sloping supply curve labeled S, with the market equilibrium price labeled as $14 and the market equilibrium quantity labeled as QM.
1.0000pts
C2The response includes a correctly labeled graph of Soja Farm showing the firm’s horizontal demand and marginal revenue curve labeled d1=MR1, extended from the market equilibrium price, with the firm’s price labeled as PF.
1.0000pts
C3The firm’s graph shows a rising marginal cost (MC) curve and shows the profit-maximizing quantity labeled QF where MR equals MC.
1.0000pts
C4The firm’s graph shows the average total cost (ATC) curve tangent to the firm’s demand curve at QF and shows the MC curve passing through the minimum point of the ATC curve.
1.0000pts
C5The response states that Soja Farm’s total revenues would decrease to $0 and explains that all consumers of soybeans would buy soybeans from other sellers who charge the market price of $14.
1.0000pts
C6The market graph from part (a) shows a rightward shift of the market demand curve with the new equilibrium price labeled P2 and the new equilibrium quantity labeled Q2.
1.0000pts
C7The firm’s graph from part (a) shows an upward shift in the firm’s marginal revenue (demand) curve at price P2 and shows the new profit-maximizing quantity for Soja Farm labeled Q*.
1.0000pts
C8The response states that the number of firms will increase in the long run and explains that the positive economic profits earned by soybean producers will encourage new firms to enter the market.
1.0000pts
C9The response states that the demand for quinoa is inelastic and explains this with one of the following: the absolute value of the price elasticity of demand for quinoa is 0.2; or the 5% decrease in the quantity demanded of quinoa is less than the 25% increase in the price of quinoa.
1.0000pts
C10The response calculates the cross-price elasticity of demand as 0.4 and shows the work: the percentage change in quantity demanded of Tofu (10%) divided by the percentage change in price of Quinoa (25%).
1.0000pts
Dependencies (0)
Page Mapping (1)
Visual Preview
14 boxes
Draw, drag, resize. Advanced coordinates are available if needed.
1
2
3
4
5
6
7
8
9
10
11
12
13
14
Select a box to edit its role and metadata.
Attribution
This material is the intellectual property of College Board, is not owned by GradeThis, and is shown here for ease of use and demonstration purposes.