2025 AP Environmental Science Free-Response Questions
Advanced PlacementAP Environmental ScienceFree ResponseScience
3 questions30 pts
3 gradable30 rubric criteria0 dependencies
q1Question 1
q1
Question 1
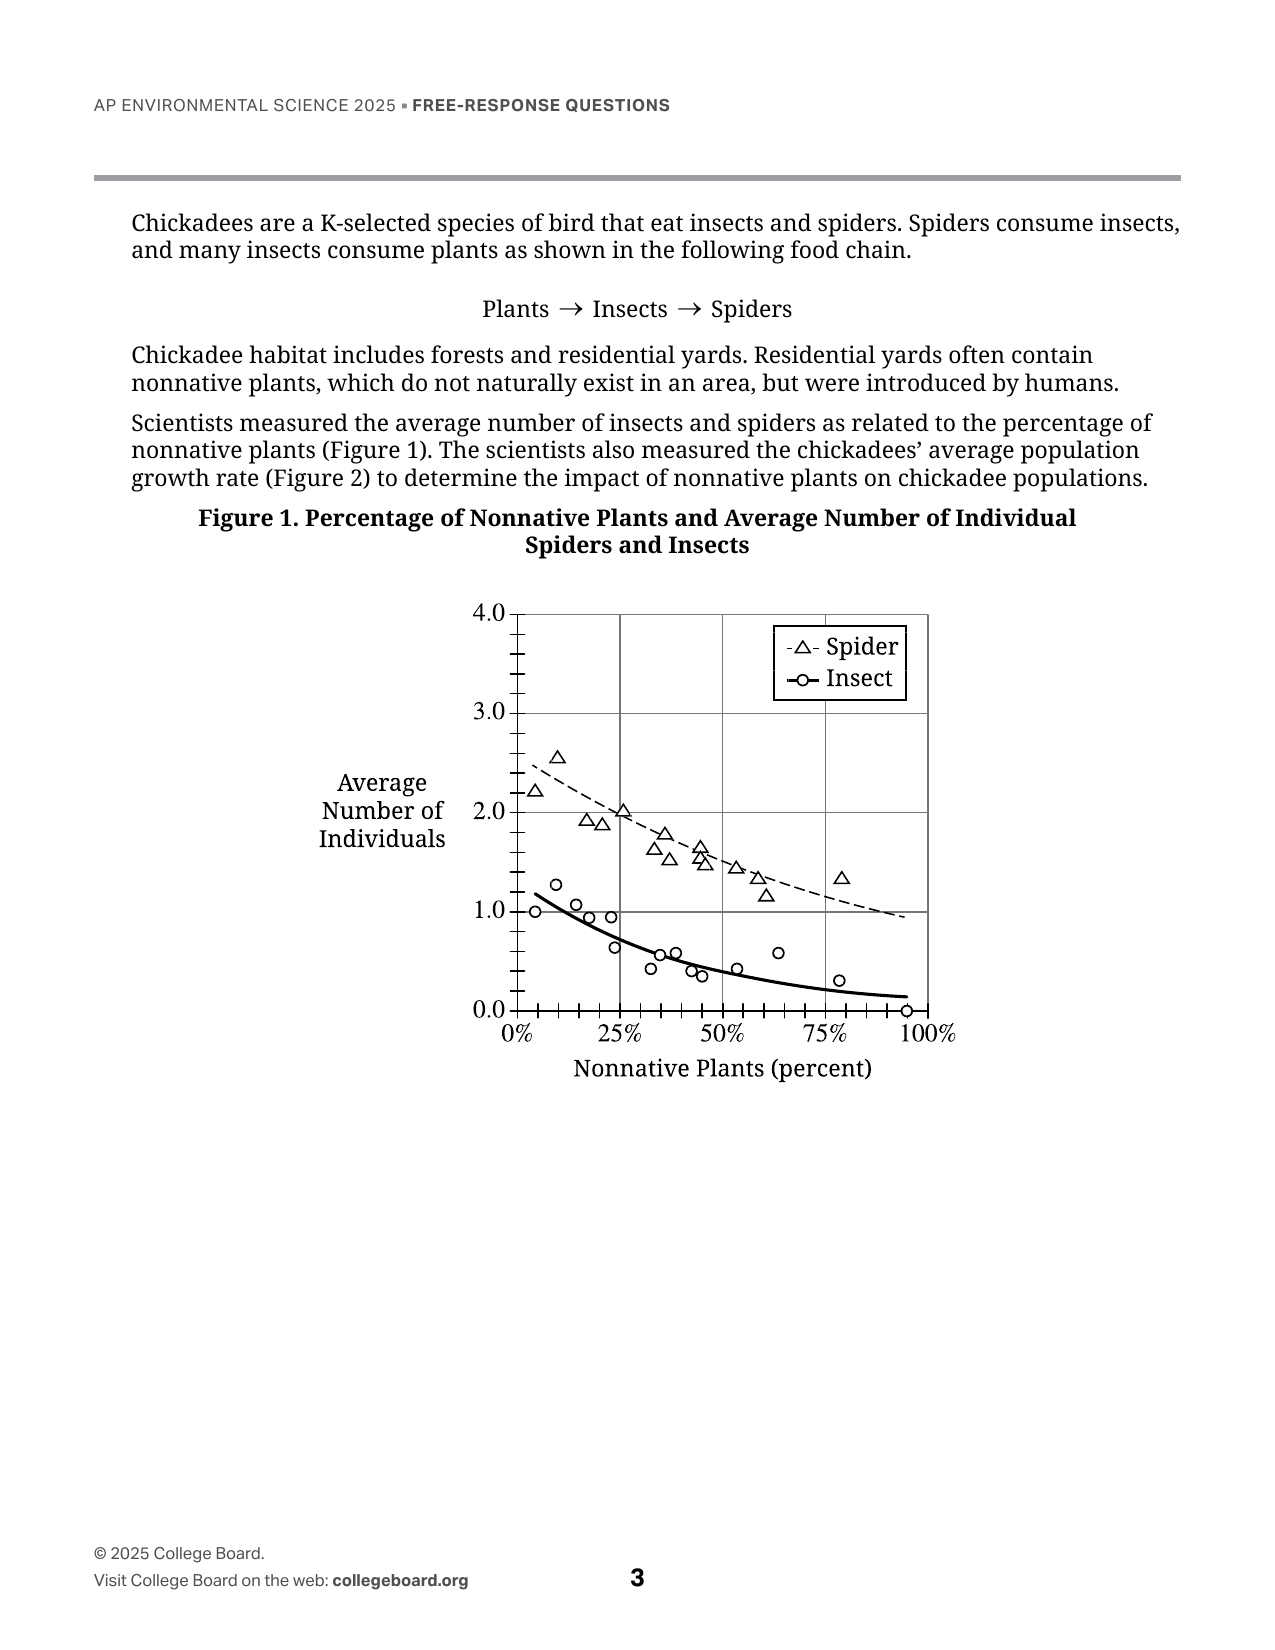
Chickadees are a K-selected species of bird that eat insects and spiders. Spiders consume insects, and many insects consume plants as shown in the following food chain. Plants → Insects → Spiders Chickadee habitat includes forests and residential yards. Residential yards often contain nonnative plants, which do not naturally exist in an area, but were introduced by humans. Scientists measured the average number of insects and spiders as related to the percentage of nonnative plants (Figure 1). The scientists also measured the chickadees’ average population growth rate (Figure 2) to determine the impact of nonnative plants on chickadee populations. Figure 1. Percentage of Nonnative Plants and Average Number of Individual Spiders and Insects. The graph shows average number of individuals versus nonnative plants (percent), with spider and insect data. Figure 2. Chickadee Population Average Growth Rate and Percentage of Nonnative. The graph shows chickadee population growth rate (r) versus nonnative plants, with a replacement level at r = 0.0. 1. Respond to parts A, B, C, D, E, F, G, and H, and all subparts. A. Describe one reproductive strategy used by a K-selected species such as the chickadee. B. Based on the information provided, explain how a decrease in spider populations could affect a lower trophic level. C. Based on the data in Figure 1, identify the number of spiders per sample at 25% nonnative plants. D. Based on the data in Figure 1, describe the trend in the number of insects per sample in relation to the percentage of nonnative plants. E. Scientists hypothesized that the population of chickadees would be stable or growing with fewer than 25% nonnative plants. Describe one way that the data in Figure 2 support this hypothesis. F. Insect biodiversity is important to maintain ecosystem health. A group of students was interested in learning about factors that affect ant biodiversity. They located two study sites near their school: a frequently mowed urban park and an unmowed grassland. The students used traps designed to collect ants. They loaded 10 of the traps with the same food and placed them randomly at different locations within each site. Students collected the traps after 24 hours and counted the number of different ant species in each trap to determine species richness. i. Identify a likely scientific question for the students’ investigation of ant diversity. ii. Identify the dependent variable in the students’ investigation. G. The data from the student investigation of ant diversity are shown in the following table. An “X” in the table indicates that the species was present at that site. Ant Species Present in an Urban Park and Unmowed Grassland | Site | Species A | Species B | Species C | Species D | Species E | Species F | |---|---|---|---|---|---|---| | Urban park | X | | | X | X | | | Grassland | X | X | X | X | | X | i. Explain why the ant community of the unmowed grassland would be more likely to recover from a disturbance, such as a flood or fire, than the ant community in the mowed urban park would. ii. Explain how the results of the investigation could have been altered if students had measured ant biodiversity at a paved playground rather than in the grassland. H. Habitat fragmentation has impacts on a variety of species. Paved roads can lead to habitat fragmentation. Describe one effect that a paved road in a forest can have on animal species such as deer or bears.
Rubric Criteria (10)
C1States one reproductive strategy of a K-selected species, such as providing considerable parental care, producing few offspring, expending significant energy per offspring, reproducing more than once during its lifetime, having a long gestation period, or reaching reproductive maturity later.
1.0000pts
C2Explains that a decrease in spider populations would increase insect populations because fewer insects would be preyed upon, or would decrease plant populations because the increased insect population would consume more plants.
1.0000pts
C3Identifies the number of spiders per sample at 25 percent nonnative plants as 2.02.
1.0000pts
C4Describes an inverse, indirect, or negative relationship between the percentage of nonnative plants and the number of insects per sample: as the percentage of nonnative plants increases, the number of insects decreases, or vice versa.
1.0000pts
C5Explains that with fewer than 25 percent nonnative plants, the chickadee growth rate is at or above replacement level, enough reproduction occurs to replace the population, or the population growth rate is positive.
1.0000pts
C6Identifies a scientific question about whether ant species number, species richness, or biodiversity differs between an urban park and a grassland, or whether mowing affects ant species number, species richness, or biodiversity.
1.0000pts
C7Identifies the dependent variable as the number of ant species, ant species richness, or the presence or absence of different ant species.
1.0000pts
C8Explains that the unmowed grassland ant community is more likely to recover because its larger number of species or greater diversity makes it more likely that some species or individuals have adaptations allowing survival, or makes loss of one species less likely to collapse the whole ecosystem.
1.0000pts
C9Explains that measuring ant biodiversity at a paved playground would produce fewer species than in the grassland or urban park because the paved area is unsuitable habitat for many ant species or because humans could trample ants or ant habitat.
1.0000pts
C10Describes one effect of a paved road in a forest on animals such as deer or bears, including vehicle strikes, fragmentation causing isolation or loss of genetic diversity, noise pollution causing hearing damage or stress or masking communication or hunting sounds, altered or prevented movement and migration, or an increase in species that thrive in edge habitats.
1.0000pts
Dependencies (0)
Page Mapping (3)
Visual Preview
6 boxes
Draw, drag, resize. Advanced coordinates are available if needed.
1
2
3
4
5
6
Select a box to edit its role and metadata.
Attribution
This material is the intellectual property of College Board, is not owned by GradeThis, and is shown here for ease of use and demonstration purposes.