2024 AP Environmental Science Free-Response Questions
Advanced PlacementAP Environmental ScienceFree ResponseScience
3 questions30 pts
3 gradable30 rubric criteria0 dependencies
q1Question 1
q1
Question 1
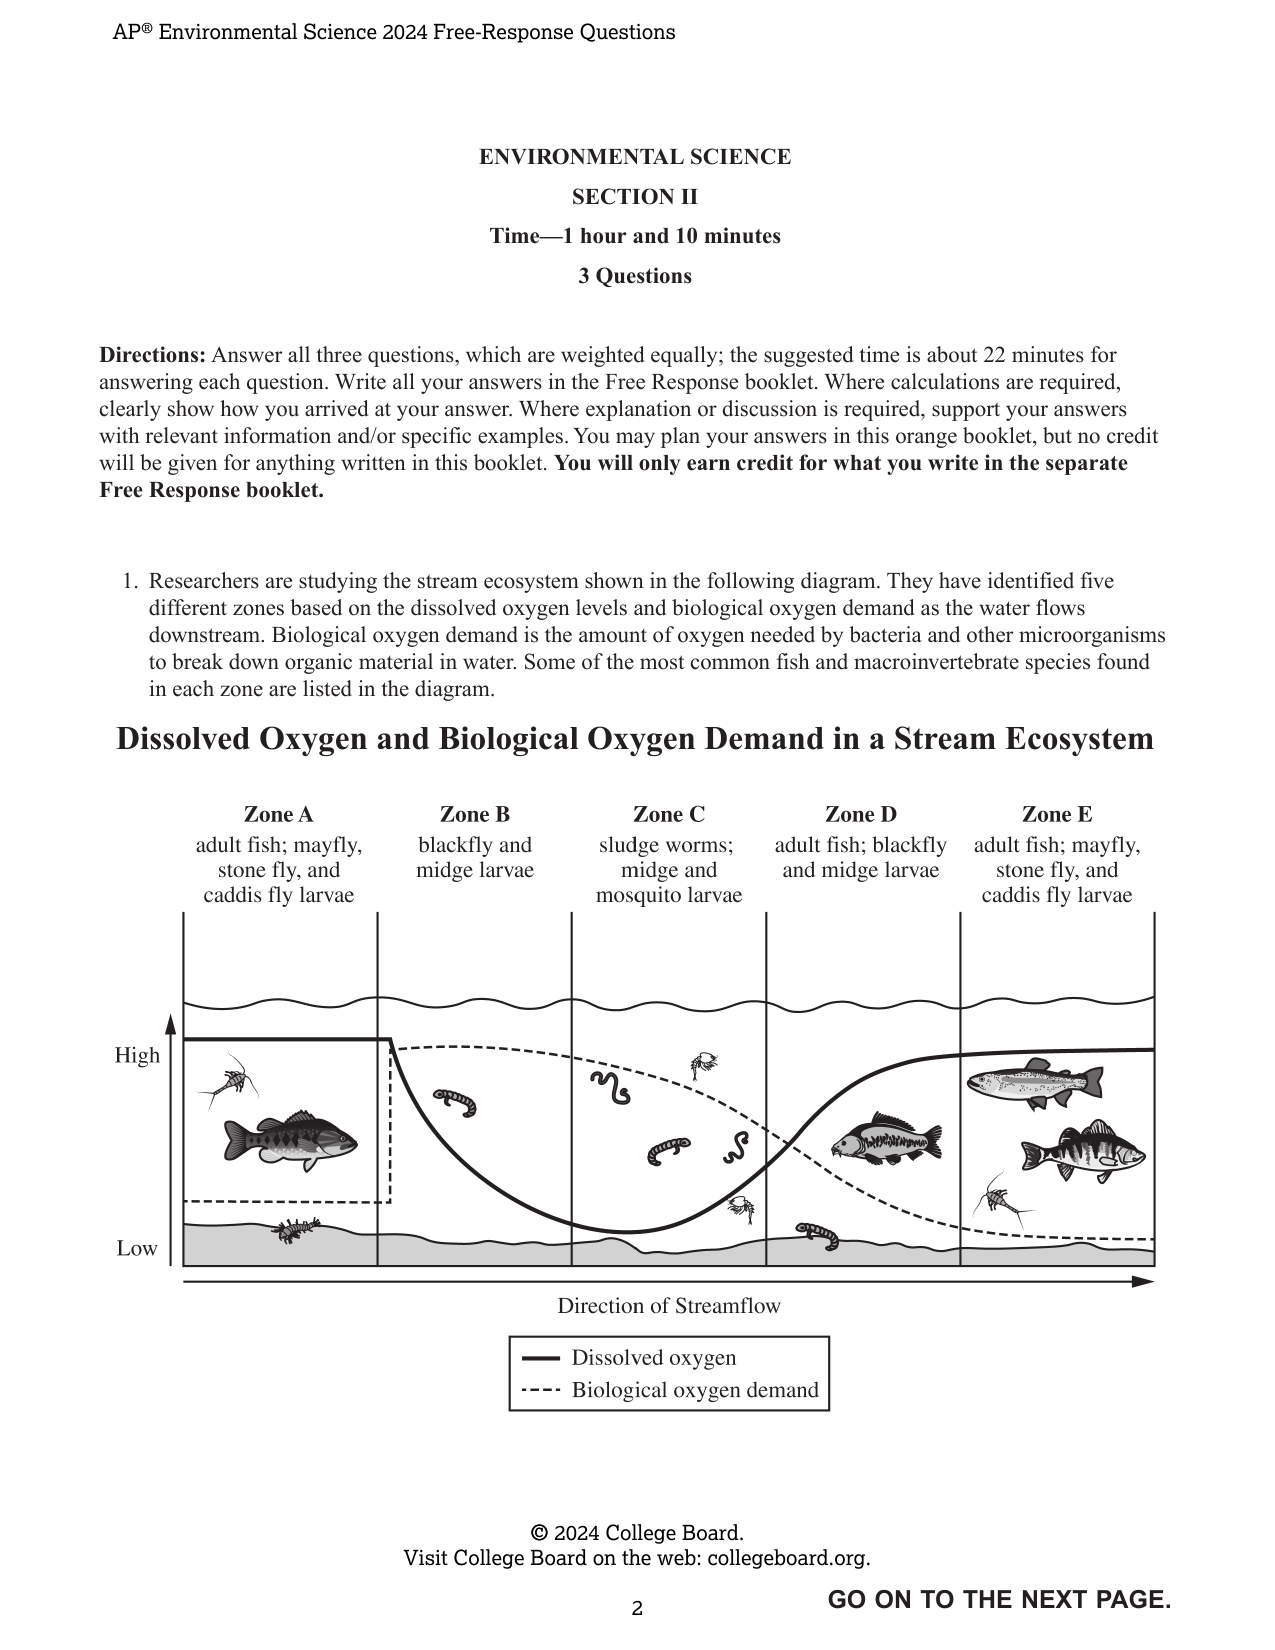
ENVIRONMENTAL SCIENCE SECTION II Time—1 hour and 10 minutes 3 Questions Directions: Answer all three questions, which are weighted equally; the suggested time is about 22 minutes for answering each question. Write all your answers in the Free Response booklet. Where calculations are required, clearly show how you arrived at your answer. Where explanation or discussion is required, support your answers with relevant information and/or specific examples. You may plan your answers in this orange booklet, but no credit will be given for anything written in this booklet. You will only earn credit for what you write in the separate Free Response booklet. 1. Researchers are studying the stream ecosystem shown in the following diagram. They have identified five different zones based on the dissolved oxygen levels and biological oxygen demand as the water flows downstream. Biological oxygen demand is the amount of oxygen needed by bacteria and other microorganisms to break down organic material in water. Some of the most common fish and macroinvertebrate species found in each zone are listed in the diagram. Dissolved Oxygen and Biological Oxygen Demand in a Stream Ecosystem Zone A: adult fish; mayfly, stone fly, and caddis fly larvae Zone B: blackfly and midge larvae Zone C: sludge worms; midge and mosquito larvae Zone D: adult fish; blackfly and midge larvae Zone E: adult fish; mayfly, stone fly, and caddis fly larvae Y-axis: High to Low X-axis: Direction of Streamflow Legend: — Dissolved oxygen - - - Biological oxygen demand (a) Based on the information in the diagram, identify the zone with the lowest level of dissolved oxygen. (b) Based on the information in the diagram, describe the relationship between biological oxygen demand and dissolved oxygen. (c) Based on the information in the diagram, identify the zone where there is most likely point-source water pollution discharged into the stream. The research team is interested in investigating the relationship between dissolved oxygen levels and macroinvertebrate species richness in the stream. Researchers counted the number of macroinvertebrate species in zones A, B, and C during the summer months. The researchers selected zone A to serve as the control in the investigation. (d) Identify the dependent variable in the researchers' investigation. (e) Identify a testable hypothesis for the researchers' investigation. (f) Describe the reason the researchers selected zone A to serve as the control in the investigation. The researchers decided to repeat their data collection during the winter months. (g) Explain how the modification to collect data in the winter months could alter the results of the investigation. Stream ecosystems are affected by point-source organic pollution in a variety of ways. (h) Describe the effect that the introduction of raw sewage into the stream could have on the population of bacteria in the stream. (i) Identify an abiotic factor other than dissolved oxygen and organic pollution that could also influence the population size of bacteria in the stream. (j) Explain how persistent organic pollutants can affect higher trophic levels in an aquatic food web. Begin your response to this question at the top of a new page in the separate Free Response booklet and fill in the appropriate circle at the top of each page to indicate the question number.
Rubric Criteria (10)
C1Identify Zone C (or C) as the zone with the lowest level of dissolved oxygen.
1.0000pts
C2Describe the relationship between biological oxygen demand and dissolved oxygen as an inverse relationship (e.g., as biological oxygen demand increases, dissolved oxygen decreases; as biological oxygen demand decreases, dissolved oxygen increases; as dissolved oxygen increases, biological oxygen demand decreases; or as dissolved oxygen decreases, biological oxygen demand increases).
1.0000pts
C3Identify Zone B (or B) as the zone where there is likely point-source water pollution discharged into the stream.
1.0000pts
C4Identify the dependent variable as the number of macroinvertebrate species, macroinvertebrate diversity, or macroinvertebrate species richness.
1.0000pts
C5Identify a testable hypothesis for the researchers’ investigation stating a relationship between dissolved oxygen levels and macroinvertebrate species (e.g., as dissolved oxygen levels increase or decrease, the number of macroinvertebrate species increases; a direct or inverse relationship between dissolved oxygen and macroinvertebrate species; or no relationship between biological oxygen demand and macroinvertebrate biodiversity).
1.0000pts
C6Describe the reason Zone A was selected to serve as the control because it is upstream from the source of pollution/organic waste/discharge/change, it would not be affected by the source of pollution/organic waste/discharge/change, or it has levels of dissolved oxygen that are not impacted by the source of pollution/organic waste/discharge/change.
1.0000pts
C7Explain how collecting data in the winter months could alter the results of the investigation by stating that cold water will have more dissolved oxygen, which could increase the number of species; colder water may be below the range of tolerance for some organisms, which could decrease the number of species; or lower light levels in the winter decrease plant activity/photosynthesis, which lowers dissolved oxygen levels, which could decrease the number of species.
1.0000pts
C8Describe the effect that the introduction of raw sewage into the stream could have on the population of bacteria by stating that raw sewage contains nutrients that could increase the population of bacteria, or that raw sewage contains bacteria that could increase the population size.
1.0000pts
C9Identify an abiotic factor other than dissolved oxygen and organic pollution that could influence the population size of bacteria in the stream, such as temperature, pH, light/sunlight, turbidity/sediment, salinity, or nitrate/phosphate.
1.0000pts
C10Explain how persistent organic pollutants can affect higher trophic levels in an aquatic food web by stating that they can bioaccumulate or accumulate/concentrate in the tissues of organisms at higher trophic levels because they consume prey that have accumulated the pollutants, because of higher fat content in their tissues, or that organisms at higher trophic levels can experience neurological toxicity because persistent organic pollutants bioaccumulate.
1.0000pts
Dependencies (0)
Page Mapping (2)
Visual Preview
5 boxes
Draw, drag, resize. Advanced coordinates are available if needed.
1
2
3
4
5
Select a box to edit its role and metadata.
Attribution
This material is the intellectual property of College Board, is not owned by GradeThis, and is shown here for ease of use and demonstration purposes.