2024 AP Biology Free-Response Questions
Advanced PlacementAP BiologyFree ResponseScience
6 questions34 pts
6 gradable34 rubric criteria0 dependencies
q1Question 1
q1
Question 1
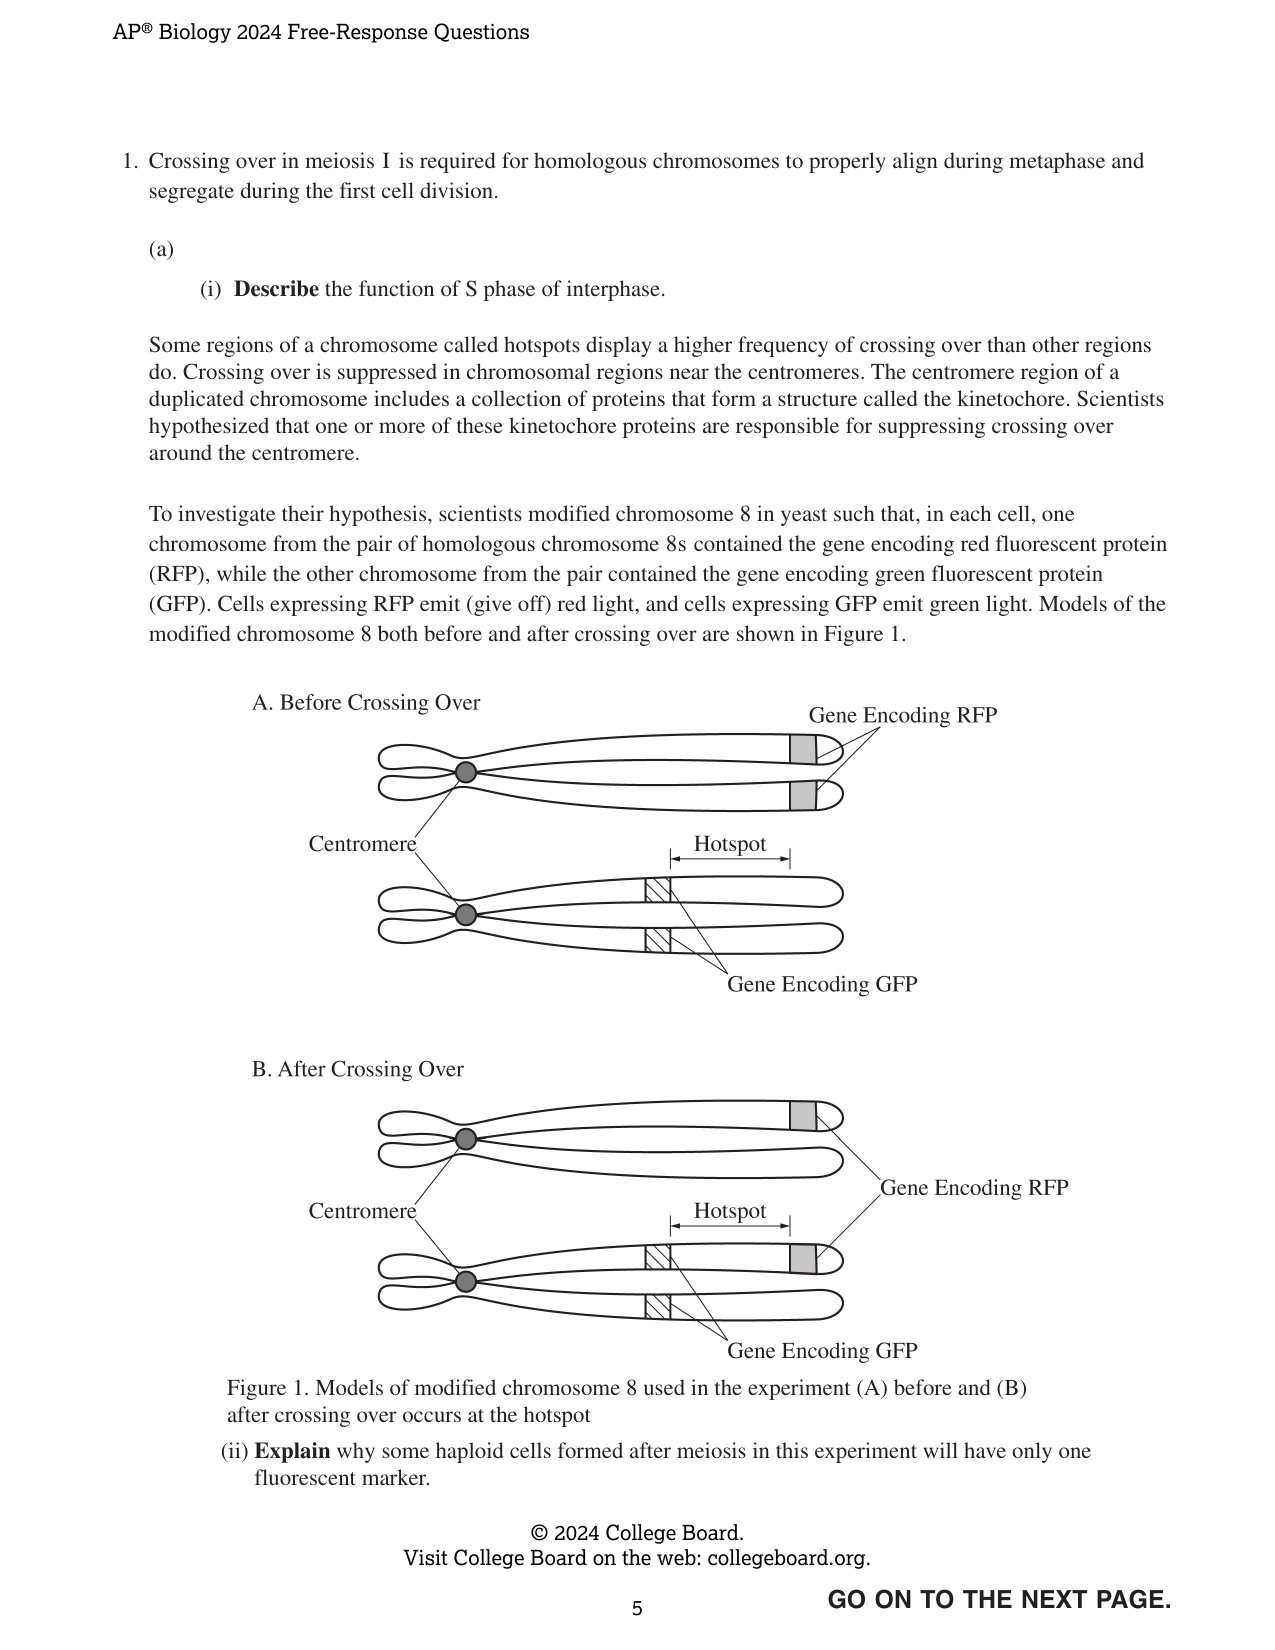
1. Crossing over in meiosis I is required for homologous chromosomes to properly align during metaphase and segregate during the first cell division. (a) (i) Describe the function of S phase of interphase. Some regions of a chromosome called hotspots display a higher frequency of crossing over than other regions do. Crossing over is suppressed in chromosomal regions near the centromeres. The centromere region of a duplicated chromosome includes a collection of proteins that form a structure called the kinetochore. Scientists hypothesized that one or more of these kinetochore proteins are responsible for suppressing crossing over around the centromere. To investigate their hypothesis, scientists modified chromosome 8 in yeast such that, in each cell, one chromosome from the pair of homologous chromosome 8s contained the gene encoding red fluorescent protein (RFP), while the other chromosome from the pair contained the gene encoding green fluorescent protein (GFP). Cells expressing RFP emit (give off) red light, and cells expressing GFP emit green light. Models of the modified chromosome 8 both before and after crossing over are shown in Figure 1. Figure 1. Models of modified chromosome 8 used in the experiment (A) before and (B) after crossing over occurs at the hotspot. The figure shows paired homologous chromosomes with centromeres labeled. In (A), before crossing over, one homolog carries the gene encoding RFP at its distal end, and the other homolog carries the gene encoding GFP at its distal end; the hotspot is located between the centromere and the fluorescent-protein genes. In (B), after crossing over within the hotspot, the chromatids have exchanged segments distal to the hotspot. (ii) Explain why some haploid cells formed after meiosis in this experiment will have only one fluorescent marker. The scientists then investigated whether attaching individual kinetochore proteins to a specific DNA sequence present in a known crossing-over hotspot on chromosome 8 affected the frequency of crossing over at this location. In their first experiment, they examined three groups of yeast cells containing the modified chromosome 8. Group 1 contained no kinetochore proteins attached to the hotspot, group 2 contained the kinetochore protein CTF attached to the hotspot, and group 3 contained the kinetochore protein IML attached to the hotspot. For each group, the scientists determined the frequency of crossing over between the RFP and GFP genes. To determine the frequency, the scientists added the number of cells emitting both red and green light to the number of cells that emitted no light and divided by the total number of cells (Figure 2). Figure 2. The frequency of crossing over in a hotspot on yeast chromosome 8 for cell groups treated with different kinetochore proteins. Error bars represent ±2SE_x̄. The bar graph shows the frequency of crossing over (%) on the y-axis (0–8) and the attached kinetochore protein treatment on the x-axis (None, CTF, IML). The None bar reaches approximately 7%, the CTF bar reaches approximately 6%, and the IML bar reaches approximately 7%. (b) (i) Identify the control group for the scientists' first experiment, shown in Figure 2. (ii) In a follow-up experiment, the scientists created a modified version of CTF in which the DNA-binding portion had been removed. They compared the frequency of crossing over in yeast cells in the presence and absence of unmodified CTF with that in yeast cells in the presence and absence of the modified CTF protein (data not shown). In the follow-up experiment, justify why the scientists used a modified CTF protein that is unable to bind to DNA as a control. (iii) Identify the independent variable in the follow-up experiment. (c) Based on Figure 2, describe the effect on the frequency of crossing over when CTF is attached to the chromosome 8 hotspot compared with the effect when IML is attached to the hotspot. (d) (i) Predict the effect on the number of copies of chromosome 8 likely to be present in the resulting daughter cells when CTF is attached to the hotspot. (ii) Provide reasoning to justify your prediction. (iii) Explain how the presence of hotspots (Figure 1) could increase the likelihood that a population will survive in the presence of selective pressures. $\textcircled{c}$ 2024 College Board. Visit College Board on the web: collegeboard.org.
Rubric Criteria (9)
C1The response states that the function of S phase of interphase is to replicate, duplicate, or synthesize DNA or chromosomes, or to double the amount of DNA.
1.0000pts
C2The response correctly explains why some haploid cells formed after meiosis in this experiment will have only one fluorescent marker by stating that some cells receive a chromosome or chromatid that did not undergo crossing over in the hotspot; that two or a multiple of two crossing-over events occurred in the hotspot; that each daughter cell receives one of the four sister chromatids and two of the sister chromatids shown in Figure 1 have only one fluorescent protein gene; or that the two chromosomes not involved in crossing over will have only the RFP or GFP gene and after meiosis II a gamete with one of these chromosomes will have only one marker.
1.0000pts
C3The response correctly identifies the control group for the scientists’ first experiment as Group 1, the group called None, or cells with no kinetochore protein attached to the chromosome.
1.0000pts
C4The response justifies the use of a modified CTF protein unable to bind to DNA as a control by stating that this enabled the scientists to determine whether DNA binding of the CTF/kinetochore protein affects or inhibits crossing over or recombination, or to determine whether just the presence of the CTF/kinetochore protein is enough to affect or inhibit the crossing over or recombination frequency.
1.0000pts
C5The response correctly identifies the independent variable in the follow-up experiment as the type of CTF used or the presence or absence of modified/unmodified CTF.
1.0000pts
C6The response correctly describes the effect on the frequency of crossing over when CTF is attached to the chromosome 8 hotspot compared with IML by stating that CTF attachment results in a decreased or lower frequency of crossing over or recombination (whereas IML had no effect), or that IML attachment results in an increased or higher frequency of crossing over or recombination compared with CTF attachment.
1.0000pts
C7The response correctly predicts that there will be zero or two copies, or one less or one extra copy, of chromosome 8 in the resulting daughter cells when CTF is attached to the hotspot.
1.0000pts
C8The response provides reasoning that cells with attached CTF molecules undergo crossing over or recombination at a lower frequency, making it more likely that nondisjunction would occur or that chromosomes would not separate properly.
1.0000pts
C9The response explains that hotspots increase genetic diversity, making it more likely that some individuals would survive and reproduce in the presence of selective pressures.
1.0000pts
Dependencies (0)
Page Mapping (2)
Visual Preview
10 boxes
Draw, drag, resize. Advanced coordinates are available if needed.
1
2
3
4
5
6
7
8
9
10
Select a box to edit its role and metadata.
Attribution
This material is the intellectual property of College Board, is not owned by GradeThis, and is shown here for ease of use and demonstration purposes.