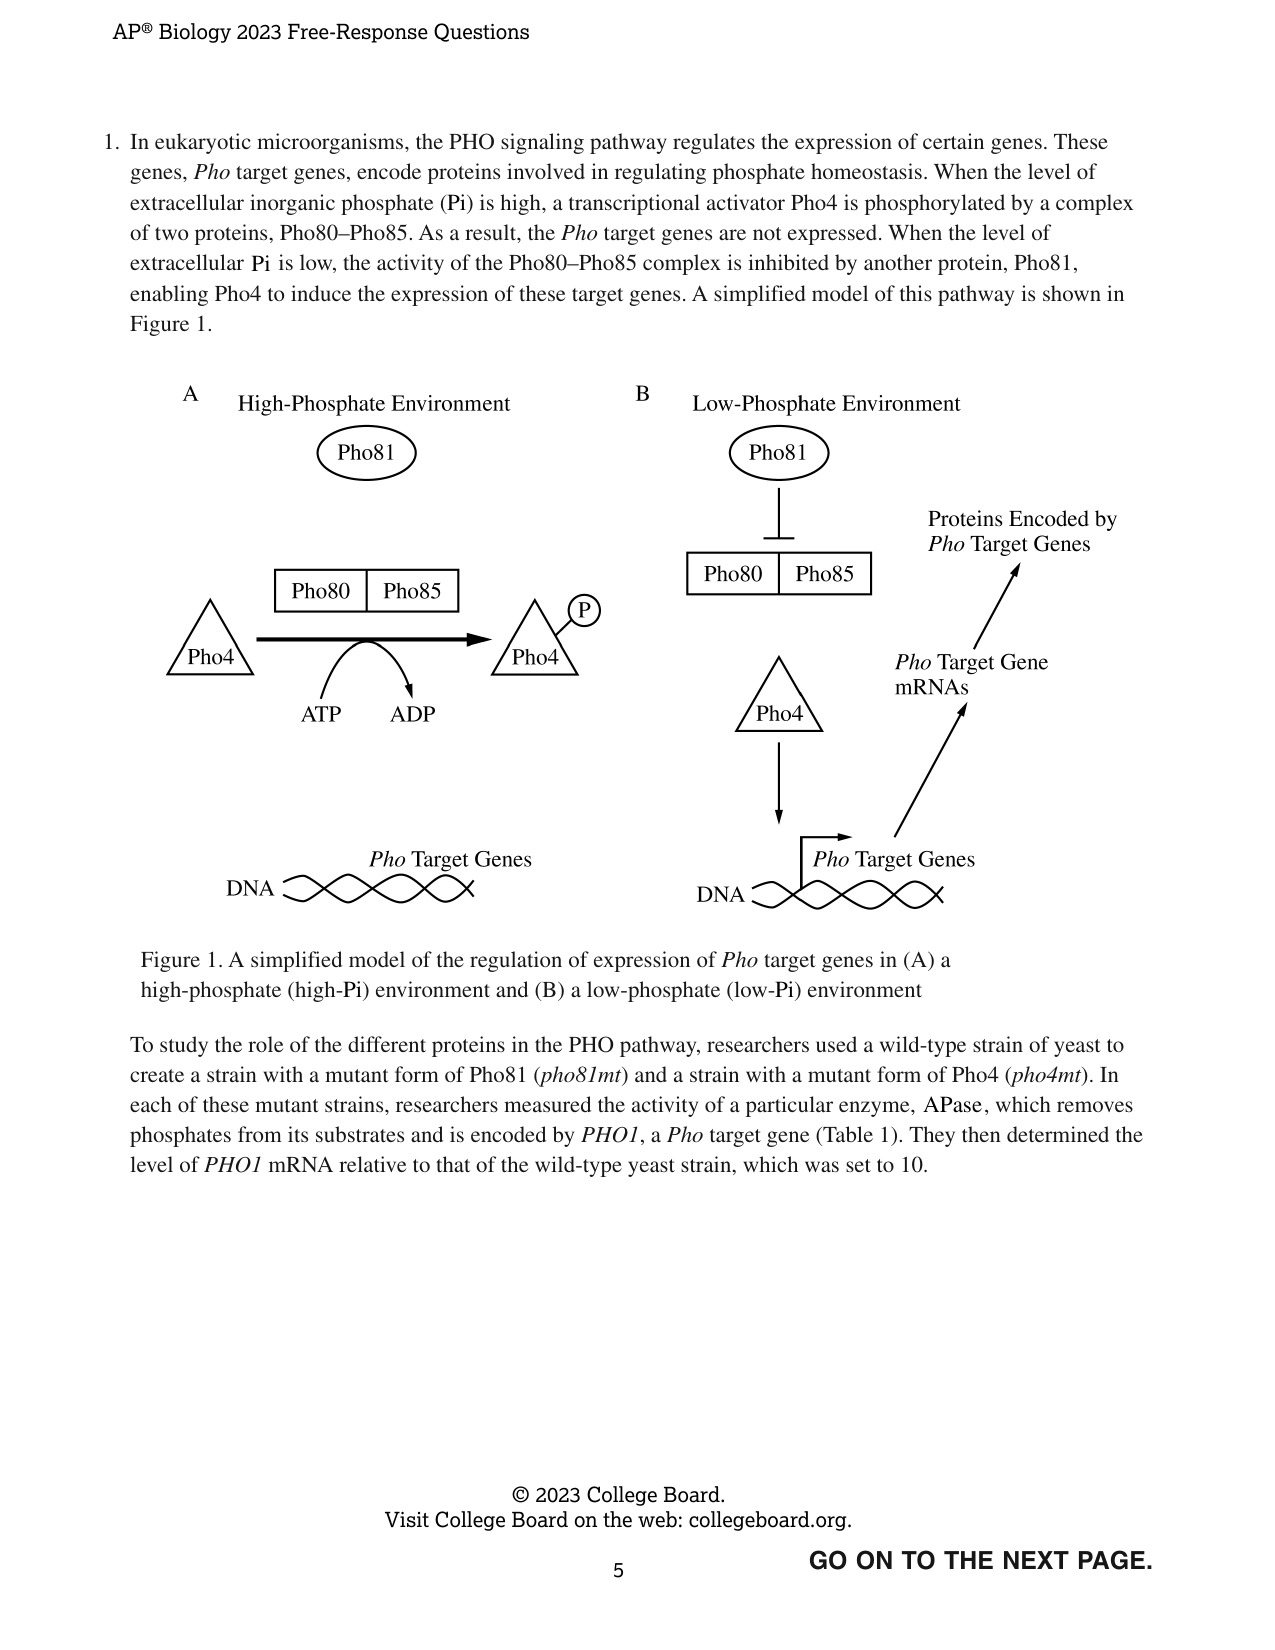
1. In eukaryotic microorganisms, the PHO signaling pathway regulates the expression of certain genes. These genes, Pho target genes, encode proteins involved in regulating phosphate homeostasis. When the level of extracellular inorganic phosphate (Pi) is high, a transcriptional activator Pho4 is phosphorylated by a complex of two proteins, Pho80–Pho85. As a result, the Pho target genes are not expressed. When the level of extracellular Pi is low, the activity of the Pho80–Pho85 complex is inhibited by another protein, Pho81, enabling Pho4 to induce the expression of these target genes. A simplified model of this pathway is shown in Figure 1. Figure 1. A simplified model of the regulation of expression of Pho target genes in (A) a high-phosphate (high-Pi) environment and (B) a low-phosphate (low-Pi) environment To study the role of the different proteins in the PHO pathway, researchers used a wild-type strain of yeast to create a strain with a mutant form of Pho81 (pho81mt) and a strain with a mutant form of Pho4 (pho4mt). In each of these mutant strains, researchers measured the activity of a particular enzyme, APase, which removes phosphates from its substrates and is encoded by PHO1, a Pho target gene (Table 1). They then determined the level of PHO1 mRNA relative to that of the wild-type yeast strain, which was set to 10. TABLE 1. APase ACTIVITY AND RELATIVE AMOUNTS OF PHO1 mRNA IN WILD-TYPE AND MUTANT STRAINS OF YEAST IN HIGH- AND LOW-PHOSPHATE ENVIRONMENTS Yeast Strain Mutation APase Activity in High-Pi Environment (mU/mL/OD600) ±2SE x̄ APase Activity in Low-Pi Environment (mU/mL/OD600) ±2SE x̄ Relative Amounts of PHO1 mRNA in High-Pi Environment ±2SE x̄ Relative Amounts of PHO1 mRNA in Low-Pi Environment ±2SE x̄ Wild-type None 0.5 ± 0.1 17.3 ± 0.9 0.1 ± 0.0 10 ± 2.0 pho81mt Nonfunctional Pho81 0.4 ± 0.1 0.6 ± 0.1 0.7 ± 0.2 0.9 ± 0.8 pho4mt Nonfunctional Pho4 0.5 ± 0.0 0.8 ± 0.2 0.6 ± 0.4 0.3 ± 0.1 (a) Describe the effect that the addition of a charged phosphate group can have on a protein that would cause the protein to become inactive. Explain how a signal can be amplified during signal transduction in a pathway such as the PHO signaling pathway. (b) Based on Table 1, identify a dependent variable in the researchers' experiment. Justify the researchers' using the wild-type strain for the creation of the mutant strains. Justify the researchers' using mutant strains in which only a single component of the pathway was mutated in each strain. (c) Based on the data in Table 1, identify the yeast strain and growth conditions that lead to the highest relative amount of PHO1 mRNA. Calculate the percent change in APase activity in wild-type yeast cells in a high-Pi environment compared with that of wild-type cells in a low-Pi environment. (d) In a follow-up experiment, researchers created a strain of yeast with a mutation that resulted in a nonfunctional Pho85 protein. Based on Figure 1, predict the effects of this mutation on PHO1 expression in the mutant strain in a high-Pi environment. Provide reasoning to justify your prediction. Write your responses to this question only on the designated pages in the separate Free Response booklet.
Draw, drag, resize. Advanced coordinates are available if needed.
2. Elevated levels of CO₂ increase the rate of photosynthesis and growth in plants. Scientists studying the mechanisms involved in these increases examined a variety of species and found that when plants are exposed to elevated levels of CO₂, there is an increase in the number of chloroplasts per cell. To investigate whether the elevated levels of CO₂ have a similar effect on the number of mitochondria in plant cells, the scientists then selected six of these species to quantify the number of mitochondria per cell when the plants were exposed to both normal and elevated levels of CO₂ (Table 1). TABLE 1. AVERAGE NUMBER OF MITOCHONDRIA IN PLANTS EXPOSED TO NORMAL AND ELEVATED LEVELS OF CO₂ Species | Mitochondria at Normal CO₂ (per 100 μm² of cell area) ±2SE_x̄ | Mitochondria at Elevated CO₂ (per 100 μm² of cell area) ±2SE_x̄ 1 | 1.0 ± 0.10 | 1.6 ± 0.10 2 | 0.4 ± 0.05 | 0.9 ± 0.08 3 | 0.5 ± 0.07 | 0.9 ± 0.10 4 | 0.3 ± 0.03 | 0.6 ± 0.06 5 | 0.7 ± 0.06 | 1.5 ± 0.22 6 | 1.3 ± 0.15 | 2.4 ± 0.22 (a) Describe the role of the inner mitochondrial membrane in cellular respiration. (b) Using the template in the space provided for your response, construct an appropriately labeled graph that represents the data in Table 1. Determine which species show(s) a difference in the number of mitochondria between normal and elevated levels of CO₂. (c) Based on the data in Table 1, describe the relationship between the level of CO₂ and the average number of mitochondria per unit area of a cell. (d) The leaves of a particular plant species are typically green, but scientists notice a plant in which the leaves have white stripes. They determine that the stripes result from a mutation in mitochondrial DNA that interferes with the development of chloroplasts. The scientists crossed plants using pollen from the plant with white-striped leaves and ovules from a plant with green leaves. Predict the phenotype(s) of the leaves of offspring produced from this cross. Provide reasoning to justify your prediction. Explain why plants with the same genotype are able to differ in the structure and/or number of certain organelles in response to changes in atmospheric levels of CO₂. Write your responses to this question only on the designated pages in the separate Free Response booklet.
Draw, drag, resize. Advanced coordinates are available if needed.
3. Sand lances of the genus Ammodytes are small fish that function as keystone organisms in several coastal ecosystems. These sand lances are prey fish that support organisms at higher trophic levels. Scientists performed experiments to examine how sand lance populations are likely to be affected by the rising temperatures and CO2 levels associated with climate change. Sand lance embryos typically develop and mature into adult fish at low temperatures (approximately 5°C) and stable, low CO2 levels (approximately 400 μatm). Over the course of two years, the scientists measured the survival rate of sand lance embryos allowed to develop and mature in a laboratory at three different temperatures, 5°C, 7°C, and 10°C, with the level of CO2 maintained at 400 μatm, 1,000 μatm, and 2,100 μatm for each temperature. (a) Describe the effect of increased biodiversity on the resilience of an ecosystem in a changing environment. (b) Justify the scientists' selecting 5°C as the lowest temperature and 400 μatm as the lowest CO2 level in their study of sand lance embryo survival. (c) State a null hypothesis for the experiment. (d) The scientists claim that a reduction in the population size of the Ammodytes sand lances will affect the stability of the entire coastal ecosystem. Provide reasoning to support the scientists' claim. Write your responses to this question only on the designated pages in the separate Free Response booklet.
Draw, drag, resize. Advanced coordinates are available if needed.
4. Noncyclic electron flow and cyclic electron flow are two major pathways of the light-dependent reactions of photosynthesis. In noncyclic electron flow, electrons pass through photosystem II, then components of a chloroplast electron transport chain, and then photosystem I before finally reducing NADP+ to NADPH. In cyclic electron flow, electrons cycle through photosystem I and some components of the electron transport chain (Figure 1). Figure 1. The pathways of noncyclic and cyclic (heavy arrows) electron flow. The cytochrome complex is a component of the electron transport chain between the two photosystems. (a) Describe the role of chlorophyll in the photosystems of plant cells. (b) Based on Figure 1, explain why an increase in the ratio of NADPH to NADP+ will cause an increase in the flow of electrons through the cyclic pathway. (c) Using rice plants, scientists examined the effect of a mutation that results in the loss of the protein CRR6. CRR6 is a part of the photosystem I complex, and its absence reduces the activity of photosystem I. Predict the effect of the mutation on the rate of biomass (dry weight) accumulation. (d) Justify your prediction in part (c). Write your responses to this question only on the designated pages in the separate Free Response booklet.
Draw, drag, resize. Advanced coordinates are available if needed.
5. Ruminants are hoofed animals, including cattle and sheep, that have a unique four-chambered stomach specialized to digest tough, fiber-filled grasses. Researchers studying ruminants are investigating the morphological and molecular characteristics of different ruminant families in order to determine the evolutionary relationships among the families. Cladograms of several ruminant families were constructed based on morphological data (Figure 1A) and molecular data (Figure 1B). Table 1 shows a sample of the morphological characteristics present in each family used to construct the cladogram in Figure 1A. A [Cladogram image based on morphological data showing Tragulidae, Giraffidae, Bovidae, Moschidae, Antilocapridae, Cervidae] B [Cladogram image based on molecular data showing Tragulidae, Giraffidae, Antilocapridae, Bovidae, Moschidae, Cervidae] Figure 1. Cladogram of six ruminant families based on (A) morphological data and (B) molecular data TABLE 1. MORPHOLOGICAL CHARACTERISTICS FOUND IN EACH RUMINANT FAMILY | Characteristic Number | Morphological Characteristic | Tragulidae | Giraffidae | Bovidae | Moschidae | Antilocapridae | Cervidae | | --- | --- | --- | --- | --- | --- | --- | --- | | 1 | Extra tooth material | | | X | | X | | | 2 | Third stomach | | X | X | X | X | X | | 3 | Double opening for tear ducts | | | | | X | X | (a) Describe how a scientist would use a comparison of the DNA sequences of different organisms to suggest the most likely evolutionary relationship among the organisms. (b) Based on Figure 1, explain why Bovidae is likely to be more closely related to Moschidae than it is to Giraffidae. (c) Using the template in the space provided for your response, represent the point(s) at which characteristic 1, listed in Table 1, evolved by marking "X" on the line(s) of the cladogram in the correct location(s). (d) Based on Figure 1A, explain why a characteristic found only in the Cervidae and Bovidae families is more likely evidence of convergent evolution than it is of common ancestry. Write your responses to this question only on the designated pages in the separate Free Response booklet.
Draw, drag, resize. Advanced coordinates are available if needed.
6. Housekeeping genes encode proteins involved in universally important processes such as transcription, translation, and glycolysis. Because these genes appear to be expressed in all cells at constant levels, the expression of housekeeping genes is often used as a control when comparing how the expression of other genes varies under different conditions. Researchers studying the effect of pesticides on declining bee populations wanted to determine whether the expression of four housekeeping genes (GAPDH, RPL32, RPS5, and TBP-AF) was in fact constant in bees across different variables. The researchers collected samples of mRNA for each of the four genes and compared how their expression varied across the developmental stage of the bee, the sex of the bee, and the cell type from which the sample was taken. The mRNA from the samples was reverse transcribed to produce DNA copies of each gene. PCR was then used to amplify the DNA, and the Cq value was determined. The Cq value is the number of PCR cycles needed to produce a specified number of DNA copies. A high Cq value for a sample indicates the gene was expressed at a low level. To analyze whether any of the examined variables affected expression of the housekeeping genes, researchers examined the range of Cq values for each gene in response to each variable. Genes with a wide range of Cq values were determined to be affected by the variable, while genes with a narrow range of Cq values were determined to be unaffected by the variable. Figure 1. The effect of developmental stage, sex, and cell type on the Cq value of four housekeeping genes (a) Based on the data in Figure 1, identify the gene that had the lowest median Cq value when bees of different developmental stages were compared. (b) The Cq value is inversely proportional to the amount of mRNA from that gene in the starting sample. Based on the data in Figure 1, identify the gene that has the lowest level of gene expression regardless of variable. (c) The scientists investigated the effect of pesticides on the expression of other genes in one cell type of a group of bees containing males and females of the same developmental stage. They hypothesized that TBP-AF would serve as the best control gene for this experiment. Use the data to evaluate their hypothesis. (d) Explain how expression of a gene such as GAPDH can vary from one cell type to another within the same bee. Write your responses to this question only on the designated pages in the separate Free Response booklet.
Draw, drag, resize. Advanced coordinates are available if needed.
This material is the intellectual property of College Board, is not owned by GradeThis, and is shown here for ease of use and demonstration purposes.