2024 AP Chemistry Free-Response Questions
Advanced PlacementAP ChemistryFree ResponseScience
7 questions46 pts
7 gradable46 rubric criteria0 dependencies
q1Question 1
q1
Question 1
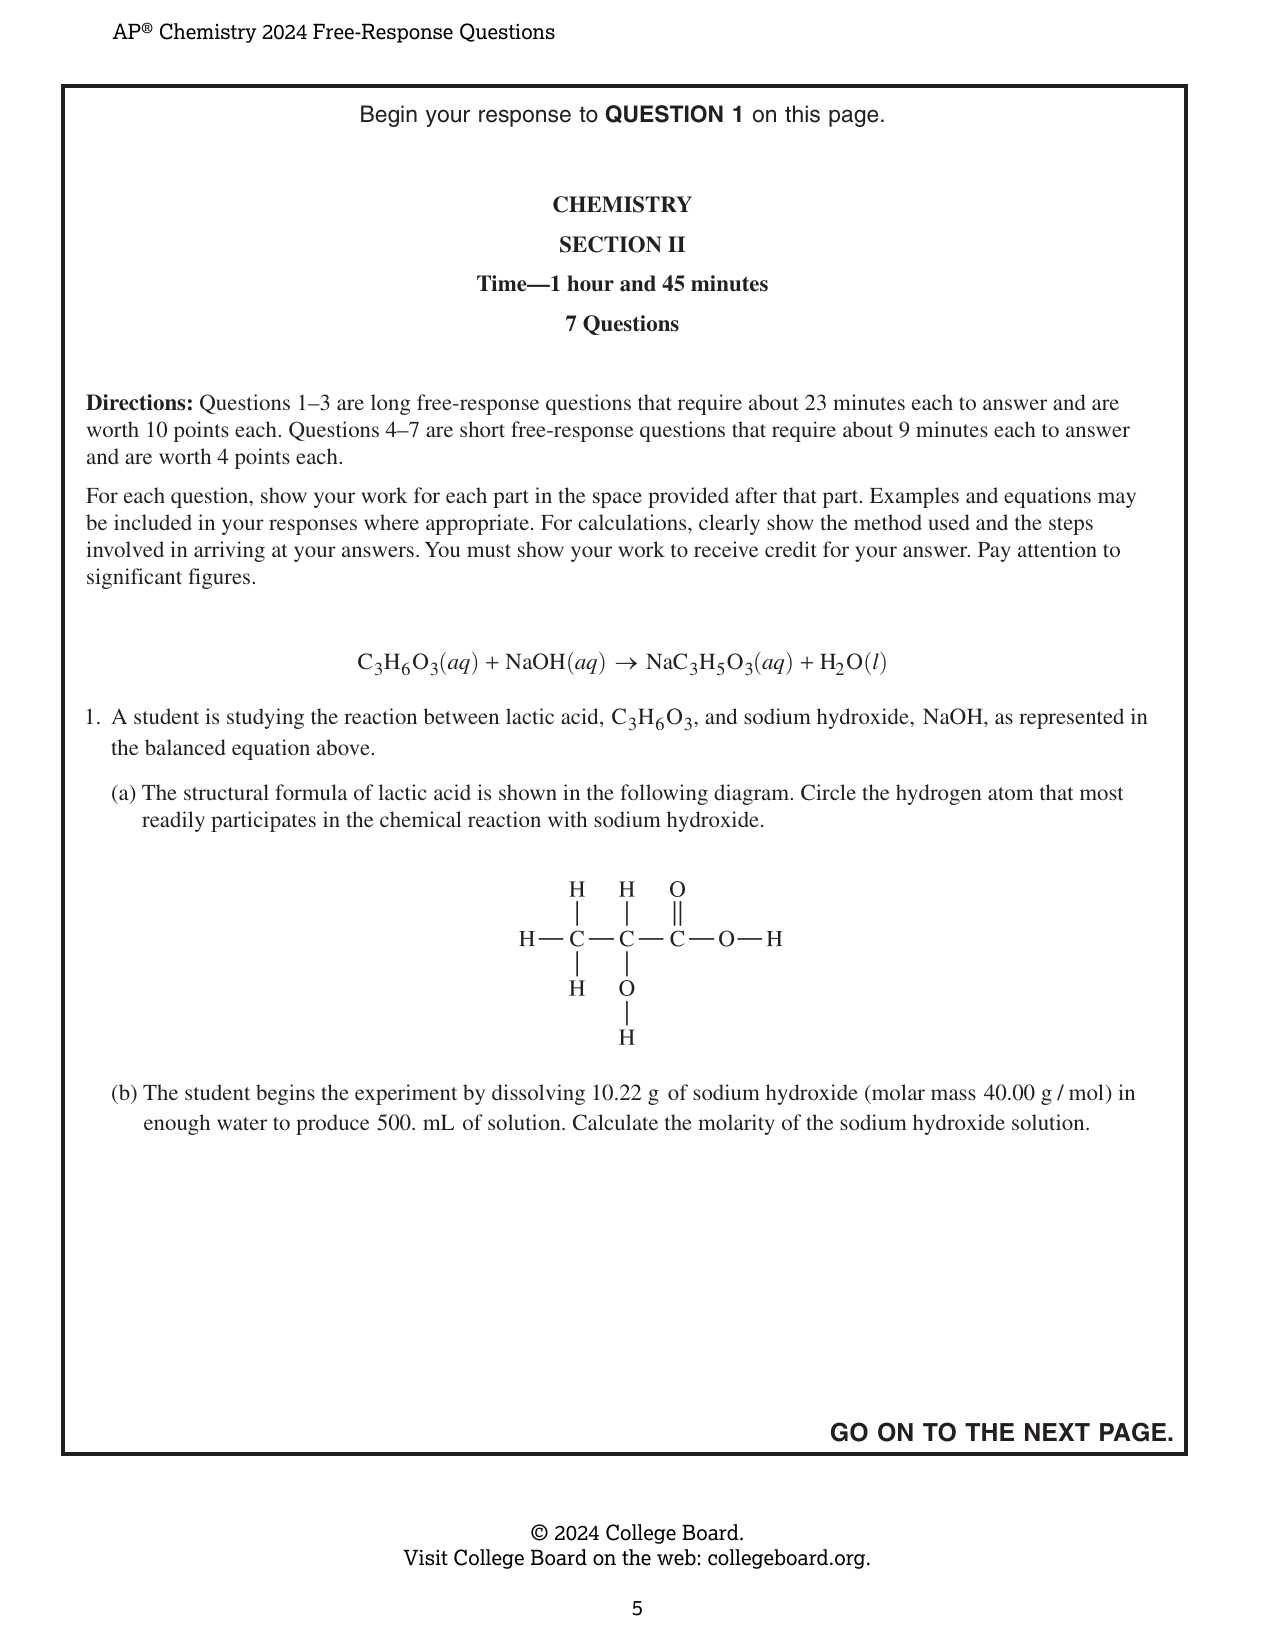
Directions: Questions 1–3 are long free-response questions that require about 23 minutes each to answer and are worth 10 points each. Questions 4–7 are short free-response questions that require about 9 minutes each to answer and are worth 4 points each. For each question, show your work for each part in the space provided after that part. Examples and equations may be included in your responses where appropriate. For calculations, clearly show the method used and the steps involved in arriving at your answers. You must show your work to receive credit for your answer. Pay attention to significant figures. C₃H₆O₃(aq) + NaOH(aq) → NaC₃H₅O₃(aq) + H₂O(l) 1. A student is studying the reaction between lactic acid, C₃H₆O₃, and sodium hydroxide, NaOH, as represented in the balanced equation above. (a) The structural formula of lactic acid is shown in the following diagram. Circle the hydrogen atom that most readily participates in the chemical reaction with sodium hydroxide. Structural formula diagram: H₃C–C(H)(OH)–C(=O)–O–H. (b) The student begins the experiment by dissolving 10.22 g of sodium hydroxide (molar mass 40.00 g/mol) in enough water to produce 500. mL of solution. Calculate the molarity of the sodium hydroxide solution. The student uses the sodium hydroxide solution from part (b), a buret, a pH meter, and a 100 mL Erlenmeyer flask to titrate a 25.0 mL sample of lactic acid solution. The student’s data are shown in the following graph. (c) Use the information in the graph to determine the approximate pKₐ of lactic acid. (d) The preceding diagram represents the relative amounts of major species in a sample of the solution in the flask at one point during the titration. (Note that water molecules are omitted.) Species diagram legend: ● = Na⁺; ○–● = C₃H₆O₃; ● = C₃H₅O₃⁻. [The diagram shows two Na⁺ ions, two C₃H₆O₃ molecules, and four C₃H₅O₃⁻ ions.] (i) Draw an X on the preceding titration curve at a point in the titration where the reaction mixture would be represented by this diagram. (ii) Justify your answer. (iii) The student repeats the experiment but uses a solution of NaOH(aq) with twice the concentration, as shown in the preceding table. On the following graph, draw the titration curve that would be expected for experiment 2. | Experiment | Mass of NaOH(s) (grams) | Volume of Solution (mL) | Titration Curve | | 1 | 10.22 | 500. | Already shown on graph | | 2 | 20.44 | 500. | ? | (e) In a third experiment, the student investigates the enthalpy of the reaction between lactic acid and sodium hydroxide. The student combines 100.0 mL of a 0.500 M lactic acid solution at 20.0°C with 100.0 mL of a 0.500 M NaOH solution at 20.0°C in a calorimeter. The final temperature of the resulting combined solution is 23.2°C. Assume that the density of each solution before combining is 1.00 g/mL and that the specific heat capacity of the combined solution is 4.2 J/(g · °C). (i) Calculate the quantity of heat produced in the reaction, in J. (ii) Calculate the molar enthalpy of reaction, in kJ/mol₍rxn₎. Include the sign in your answer. (iii) The student claims that if heat is lost from the calorimeter to the surrounding air during the reaction, then the experimental value of the molar enthalpy of reaction will be smaller in magnitude than the actual value. Do you agree or disagree with the student’s claim? Justify your answer.
Rubric Criteria (10)
C1The response circles the rightmost hydrogen atom.
1.0000pts
C2The response calculates the concentration as 0.511 M using 10.22 g, 40.00 g/mol, and 0.500 L.
1.0000pts
C3The response gives pKa = 3.9, with values from 3.7 through 4.0 acceptable.
1.0000pts
C4The response places X at a volume greater than or equal to 3 mL and less than 8 mL.
1.0000pts
C5The response explains that more acid particles than conjugate-base particles are present, so the titration is before the half-equivalence point.
1.0000pts
C6The response draws the titration curve with the equivalence point at 8 mL.
1.0000pts
C7The response draws a curve that begins at the same pH as the first curve, gradually increases, rises sharply at a volume different from 16 mL, and ends at a pH similar to the first curve.
1.0000pts
C8The response calculates q = 2700 J using q = mcΔT, with m = 200.0 g, c = 4.2 J/(g·°C), and ΔT = 23.2°C − 20.0°C.
1.0000pts
C9The response calculates qrxn = −2.7 kJ and ΔHrxn = −54 kJ/molrxn by dividing qrxn by (0.100 L)(0.500 mol/L).
1.0000pts
C10The response agrees that heat lost from the system would produce a lower final temperature and therefore smaller-than-actual values of ΔT, qsoln, and ΔH.
1.0000pts
Dependencies (0)
Page Mapping (4)
Visual Preview
6 boxes
Draw, drag, resize. Advanced coordinates are available if needed.
1
2
3
4
5
6
Select a box to edit its role and metadata.
Attribution
This material is the intellectual property of College Board, is not owned by GradeThis, and is shown here for ease of use and demonstration purposes.