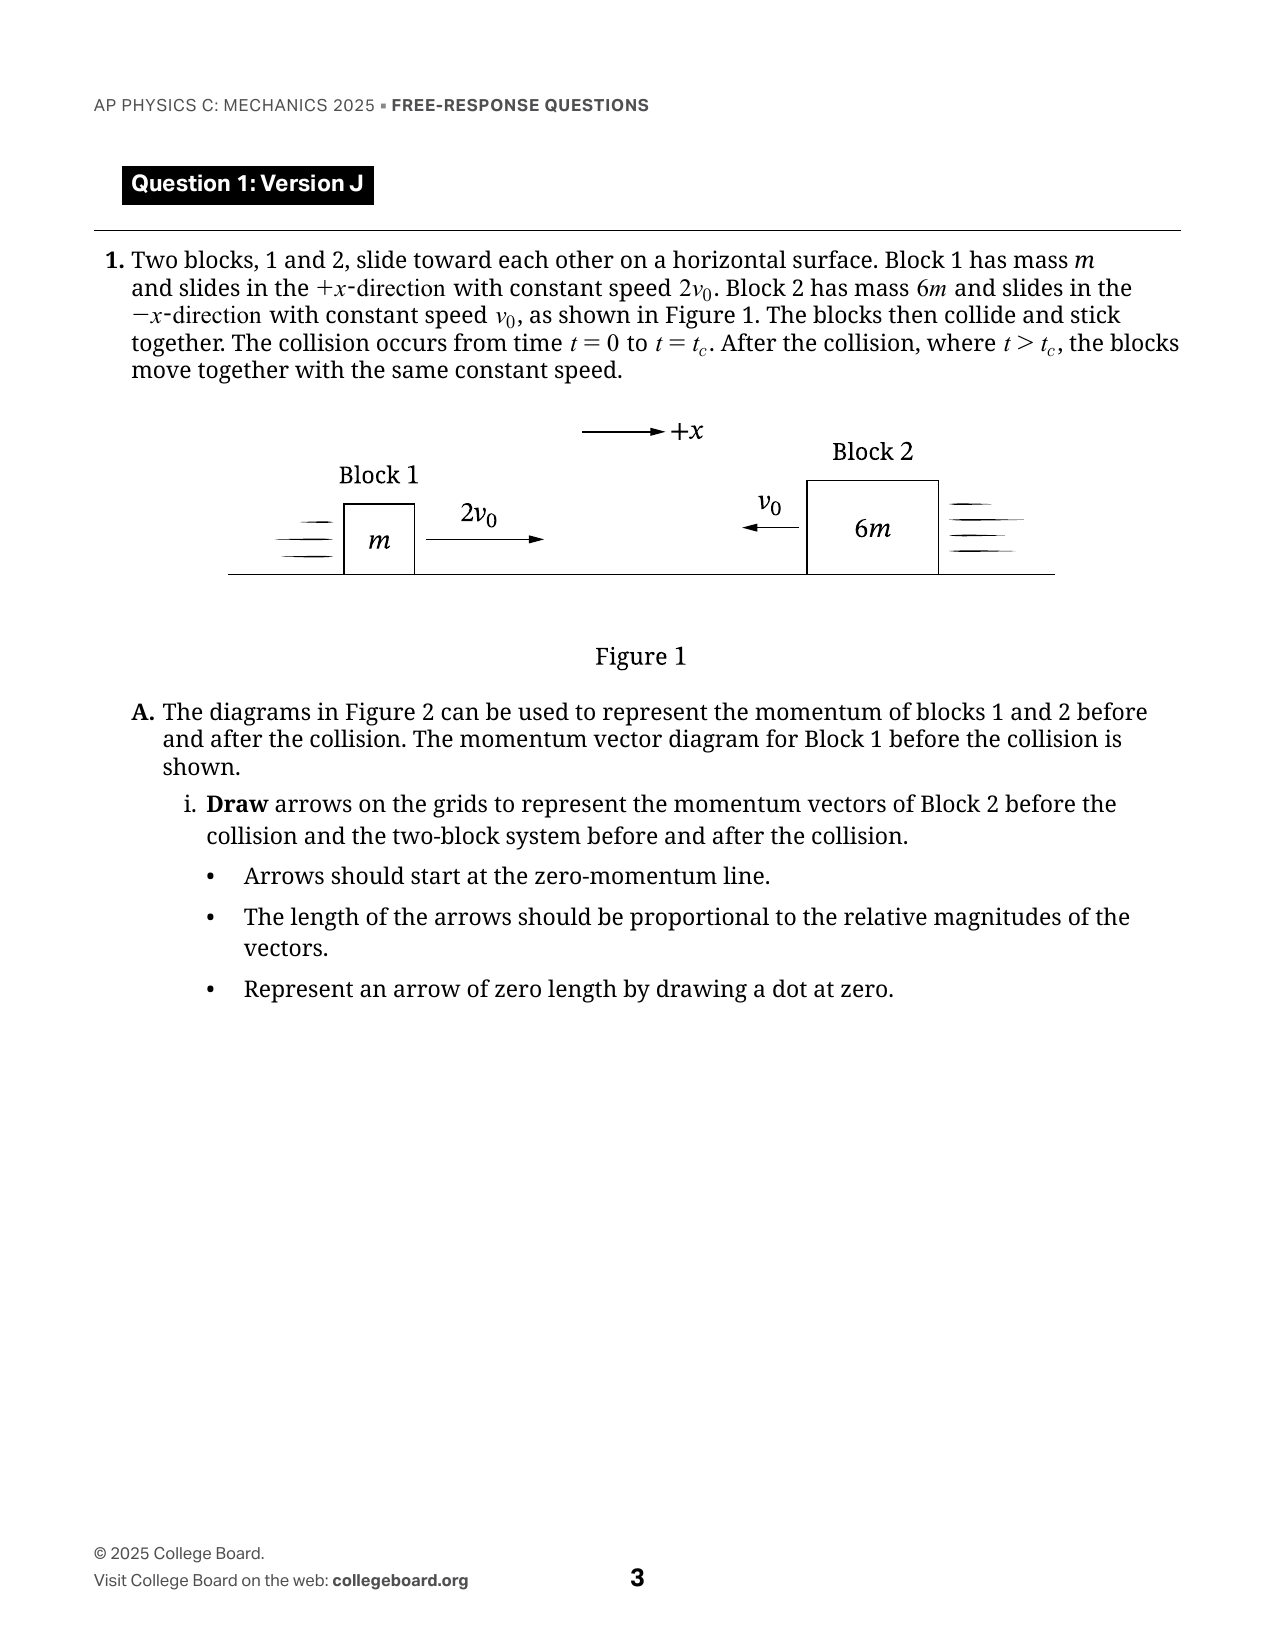
1. Two blocks, 1 and 2, slide toward each other on a horizontal surface. Block 1 has mass m and slides in the +x-direction with constant speed 2v₀. Block 2 has mass 6m and slides in the −x-direction with constant speed v₀, as shown in Figure 1. The blocks then collide and stick together. The collision occurs from time t = 0 to t = t_c. After the collision, where t > t_c, the blocks move together with the same constant speed. [Figure 1 shows Block 1 of mass m moving in the +x-direction at speed 2v₀ and Block 2 of mass 6m moving in the −x-direction at speed v₀.] A. The diagrams in Figure 2 can be used to represent the momentum of blocks 1 and 2 before and after the collision. The momentum vector diagram for Block 1 before the collision is shown. i. Draw arrows on the grids to represent the momentum vectors of Block 2 before the collision and the two-block system before and after the collision. • Arrows should start at the zero-momentum line. • The length of the arrows should be proportional to the relative magnitudes of the vectors. • Represent an arrow of zero length by drawing a dot at zero. [Figure 2: A momentum-vector grid with columns labeled “Momentum Before Collision” and “Momentum After Collision,” and rows labeled “Block 1,” “Block 2,” and “Two-Block System.” The Block 1 before-collision grid shows a right-pointing arrow; the other indicated grids are provided for drawing the requested vectors.] ii. During the time interval 0 ≤ t ≤ t_c, a force F is exerted on Block 2 by Block 1 along the x-direction as a function of t that is modeled by F(t) = F_max sin(At), where A is a positive constant and F_max is the magnitude of the maximum force exerted on Block 2 by Block 1 during the collision. Derive an expression for F_max. Express your answer in terms of m, v₀, A, t_c, and physical constants, as appropriate. Begin your derivation by writing a fundamental physics principle or an equation from the reference information. B. Consider a new scenario where Block 1 initially slides in the +x-direction with a new constant speed v₁ and Block 2 again initially slides in the −x-direction with constant speed v₀. The blocks collide and stick together. In this new scenario, the two-block system has constant speed v₀ after the collision. Derive an expression for v₁ in terms of v₀. Begin your derivation by writing a fundamental physics principle or an equation from the reference information.
Draw, drag, resize. Advanced coordinates are available if needed.
2. In Scenario 1, a system composed of two springs, A and B, and a block of mass m is at rest on a horizontal surface. Friction between the block and the surface is negligible. Each spring is attached to a fixed wall and the block, as shown in Figure 1. Spring A has a spring constant k and Spring B has a spring constant 2k. Each spring is at its relaxed length when the block is at position x = 0, as shown in Figure 1. Figure 1: A block between Spring A on the left and Spring B on the right, with the equilibrium position labeled x = 0. Spring A has spring constant k; Spring B has spring constant 2k. The block is moved to x = x₁ and held at rest, as shown in Figure 2. Figure 2: The block is displaced to the right of x = 0 to position x = x₁, with the positive x direction to the right and positive y direction upward. Spring A is stretched and Spring B is compressed. A. An energy bar chart can be used to represent the elastic potential energy U_A of Spring A, the elastic potential energy U_B of Spring B, and the kinetic energy K_block of the block. On the energy bar chart in Figure 3, draw shaded bars to represent the energy of the system for when the block is at x = x₁. • The height of the shaded bars should be proportional to the relative values of U_A, U_B, and K_block. • Any energy that is equal to zero should be represented by a distinct line on the zero-energy line. Figure 3: Energy bar chart with three columns labeled U_A, U_B, and K_block, and a zero-energy line labeled 0. B. The block is released from rest at x = x₁ and begins to oscillate. Derive an expression for the speed v of the block as the block passes through x = 1/2 x₁. Express your answer in terms of m, k, x₁, and physical constants, as appropriate. Begin your derivation by writing a fundamental physics principle or an equation from the reference information. C. In Scenario 1, the block oscillates with period T. The position x of the block in Scenario 1 as a function of time t is shown in Figure 4. Figure 4: Scenario 1 position-versus-time graph. The vertical axis is x, with +x₁ and −x₁ marked; the horizontal axis is t, with marks at 1/2 T, T, 3/2 T, 2T, 5/2 T, and 3T. The curve starts at +x₁ at t = 0, reaches −x₁ at t = 1/2 T, +x₁ at t = T, and continues periodically. In Scenario 2, the block-springs system is placed on a new surface. There is friction between the block and the new surface. The block is again moved to the same position x = x₁ and released from rest. The block completes multiple oscillations with the same period as in Scenario 1 before coming to rest. On the axes shown in Figure 5, sketch a graph of the kinetic energy K of the block as a function of t for Scenario 2. Figure 5: Blank axes for K as a function of t, with K on the vertical axis and t on the horizontal axis. The horizontal axis is marked at 1/2 T, T, 3/2 T, 2T, 5/2 T, and 3T. The graph is labeled Scenario 2. D. In Scenario 3, the block is replaced with a new block of larger mass. The coefficient of kinetic friction between the new block and the surface in Scenario 3 is the same as the coefficient of kinetic friction between the original block and the surface in Scenario 2. The new block is moved to position x = x₁ and released from rest. The kinetic energy of the new block is plotted as a function of time. Describe how one feature of the graph of K as a function of t in Scenario 3 would differ from the graph you drew in Figure 5 for Scenario 2. Briefly justify your answer.
Draw, drag, resize. Advanced coordinates are available if needed.
3. A box is connected to one end of a rigid rod. Both the box and the rod have negligible mass. The other end of the rod is connected to a pivot. The box is open on one side, and a block is placed inside the box. The center of mass of the block is displaced a vertical distance h, as shown in Figure 1. The block-box system is then released from rest and swings downward. There is negligible friction about the pivot. When the system is at the lowest point of its swing, the rod collides with a rigid stopper, as shown in Figure 2. The box comes to rest, and the block is launched horizontally out of the box. The block moves across a horizontal surface toward a motion sensor that measures the speed of the block. All frictional forces are negligible. Figure 1: Diagram of the pivot, rod, box, and block, with the center of mass displaced a vertical distance h. Figure 2: Diagram of the box stopping at the lowest point while the block is launched horizontally. A. Students are asked to experimentally determine the acceleration due to gravity g using a linear graph. To determine g, the students are permitted to use measurements from only a meterstick and the motion sensor. Describe an experimental procedure using the described setup to collect data that would allow the students to determine an experimental value of g using a linear graph. Include any steps necessary to reduce experimental uncertainty. B. Describe how the data collected in part A could be graphed and how that graph would be analyzed to determine the value of g. C. The experiment is repeated, but the horizontal surface on which the block slides is replaced with a new rough surface, as shown in Figure 3. The coefficient of kinetic friction between the block and the new surface is μ. Figure 3: Diagram showing the block initially at x = 0 on the rough horizontal surface and coming to rest at x = xmax. The block-box system is pulled aside so that the center of mass of the block is displaced various vertical distances h and then released from rest. For each vertical distance, students measure the position x = xmax at which the block comes to rest. The students’ measurements of h and xmax are shown in Table 1. Table 1 h (m) | xmax (m) 0.30 | 0.76 0.45 | 1.10 0.60 | 1.40 0.75 | 1.90 0.90 | 2.30 i. Indicate two quantities, either measured quantities from Table 1 or additional calculated quantities, that could be graphed to produce a straight line that could be used to determine μ. Vertical axis: _____ Horizontal axis: _____ ii. On the grid provided, create a graph of the quantities indicated in part C (i). • Use Table 2 to record the measured or calculated quantities that you will plot. • Clearly label the axes, including units as appropriate. • Plot the points you recorded in Table 2. [Graph grid] iii. Draw a best-fit line to the data graphed in part C (ii). D. Using the best-fit line that you drew in part C (iii), calculate an experimental value for μ.
Draw, drag, resize. Advanced coordinates are available if needed.
4. A uniform disk and ring, each of mass M and radius R, roll without slipping along a horizontal surface, as shown in Figure 1. The outer edges of the disk and ring are made of the same material. The center of mass of the disk and the center of mass of the ring each initially move with the same constant speed v. The disk and the ring then smoothly transition to a ramp that is inclined at an angle θ above the horizontal. Both the disk and the ring continue to roll without slipping as they move up the ramp, as shown in Figure 2. The ring travels a greater distance along the ramp than the disk travels before each momentarily comes to rest. Figure 1: Diagram labeled “Disk” and “Ring,” each with radius R, rolling without slipping along a horizontal surface toward a ramp inclined at angle θ above the horizontal. Figure 2: Diagram showing the disk and ring rolling without slipping up the inclined ramp at angle θ. A. While the disk and the ring are rolling on the ramp without slipping, the magnitudes of the static frictional force exerted on the disk and on the ring by the ramp are f_D and f_R, respectively. Indicate whether f_D is greater than, less than, or equal to f_R by writing one of the following. • f_D > f_R • f_D < f_R • f_D = f_R Justify your answer using qualitative reasoning beyond referencing equations. B. A cylinder has mass M, radius R, and rotational inertia I about its central axis. The cylinder rolls without slipping up a ramp that is inclined at an angle θ above the horizontal. Derive an expression for the magnitude of the static frictional force f exerted on the cylinder by the ramp. Express your answer in terms of M, R, I, θ, and physical constants, as appropriate. Begin your derivation by writing a fundamental physics principle or an equation from the reference information. C. In a different scenario, the centers of mass of the original disk and ring each have the same initial speed v as they did in the original scenario. The ramp is replaced by a new ramp on which the disk and the ring initially slip as they roll up the new ramp. Indicate whether the magnitude of the kinetic frictional force exerted on the disk by the new ramp is greater than, less than, or equal to the magnitude of the kinetic frictional force exerted on the ring by the new ramp while both are slipping. Briefly justify your answer.
Draw, drag, resize. Advanced coordinates are available if needed.
This material is the intellectual property of College Board, is not owned by GradeThis, and is shown here for ease of use and demonstration purposes.