2024 AP Physics C: Mechanics Free-Response Questions
Advanced PlacementAP Physics C: MechanicsFree ResponseScience
3 questions45 pts
3 gradable45 rubric criteria0 dependencies
q1Question 1
q1
Question 1
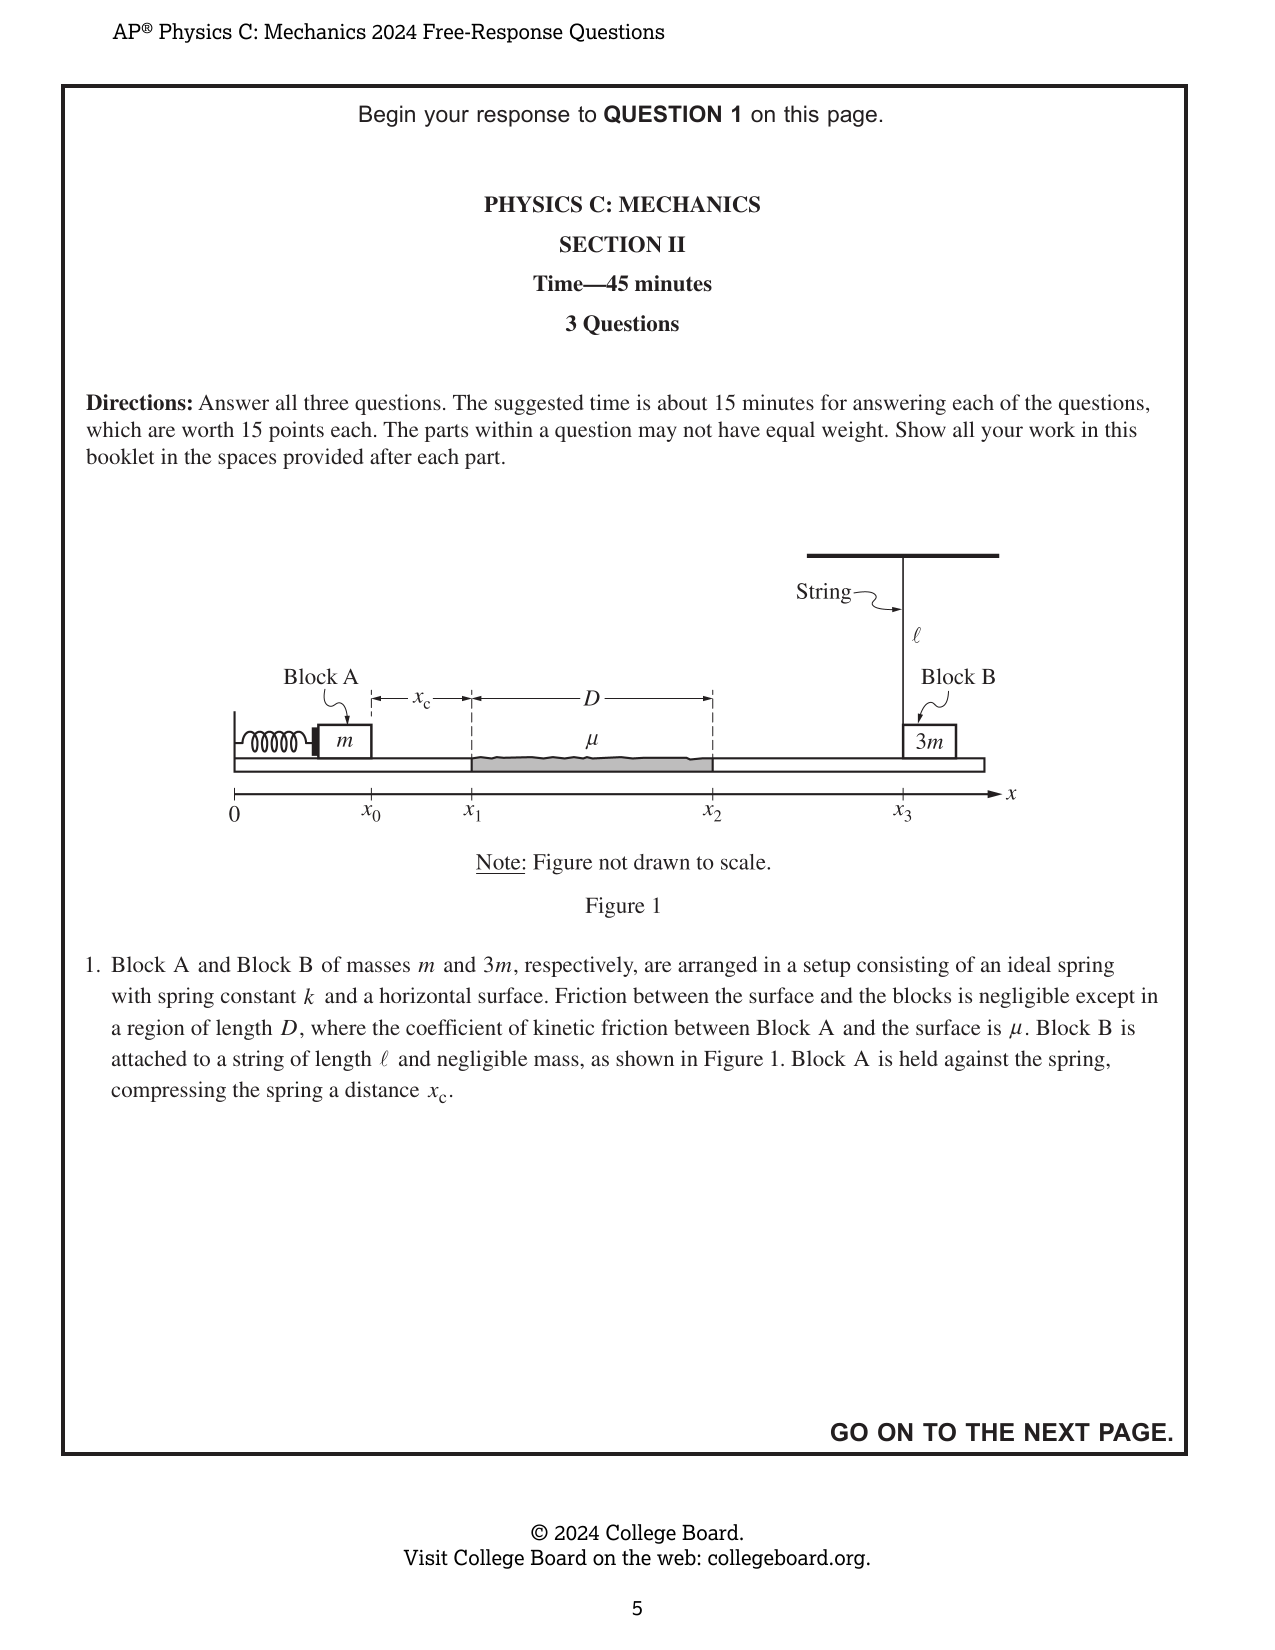
Directions: Answer all three questions. The suggested time is about 15 minutes for answering each of the questions, which are worth 15 points each. The parts within a question may not have equal weight. Show all your work in this booklet in the spaces provided after each part. Figure 1: Block A, of mass m, is attached to an ideal spring on a horizontal surface. Block B, of mass 3m, is attached to a string of length ℓ. The horizontal axis is labeled x, with positions x0, x1, x2, and x3. Block A initially compresses the spring a distance xc. A region of length D has coefficient of kinetic friction μ. The figure also labels the spring constant k, the string length ℓ, and the point x=0. Note: Figure not drawn to scale. 1. Block A and Block B of masses m and 3m, respectively, are arranged in a setup consisting of an ideal spring with spring constant k and a horizontal surface. Friction between the surface and the blocks is negligible except in a region of length D, where the coefficient of kinetic friction between Block A and the surface is μ. Block B is attached to a string of length ℓ and negligible mass, as shown in Figure 1. Block A is held against the spring, compressing the spring a distance xc. At time t = 0, Block A is located at position x = x0 and is released from rest. After the block is released, the following occurs. • At time t = t1, Block A is at x = x1 after traveling a distance xc. Block A moves with speed v, and the spring is at its equilibrium position. • At time t = t2, the left side of Block A is at x = x2 after passing through a distance D across the region with nonnegligible friction. • At time t = t3, Block A is at x = x3 and Block A collides with and sticks to Block B. (a) For parts (a)(i) and (a)(ii), express your answer in terms of m, k, D, μ, xc, and physical constants, as appropriate. i. Derive an expression for the speed v of Block A at time t1. ii. Derive an expression for the speed vA,B of the two-block system immediately after the collision at time t3. (b) i. On the following axes, sketch a graph of the kinetic energy K of Block A as a function of time t from time t = 0 to time t3. The axes show K versus t, with marked times 0, t1, t2, and t3. ii. Use principles of work and energy to justify the graph drawn in part (b)(i) for the time interval t = 0 to t = t1. Explicitly reference features of the shape of the graph you drew in part (b)(i). After the collision, the two-block system instantaneously comes to rest at time t4, which occurs when the string makes a small angle θmax with the vertical, as shown in Figure 2. For times t > t4, the system oscillates with frequency fℓ. The support holding the string is raised, and the procedure is then repeated using a new string of length 2ℓ. (c) Indicate how the new frequency of oscillation f2ℓ of the system on the new string of length 2ℓ will compare to the frequency of oscillation fℓ from the original procedure. _____ f2ℓ > fℓ _____ f2ℓ < fℓ _____ f2ℓ = fℓ Briefly justify your answer.
Rubric Criteria (15)
C1The response derives the initial speed using conservation of mechanical energy, showing that the system initially has spring potential energy and relating it to the block’s final kinetic energy, such as 1/2 kx_c^2 = 1/2 mv^2.
1.0000pts
C2The response gives the correct expression for the speed, v = x_c√(k/m).
1.0000pts
C3The response derives the speed at x_2 using either an appropriate conservation-of-energy equation or an appropriate kinematics equation.
1.0000pts
C4The response gives an expression consistent with its preceding derivation for either the energy dissipated by friction, ΔE_friction = μmgD, or the acceleration in the friction region, a = −μg.
1.0000pts
C5The response attempts to derive the postcollision speed v_A,B using conservation of momentum.
1.0000pts
C6The response substitutes a speed at x_2 consistent with its earlier work into the conservation-of-momentum equation and uses the correct masses, including m for the initial moving block and 4m for the combined mass after collision.
1.0000pts
C7The sketch is nonlinear, begins at zero, and increases throughout 0 ≤ t ≤ t_1.
1.0000pts
C8The sketch decreases throughout t_1 ≤ t ≤ t_2 and does not reach zero during that interval.
1.0000pts
C9The sketch is concave up throughout t_1 ≤ t ≤ t_2.
1.0000pts
C10The sketch is continuous from t_1 through t_3 and is a horizontal line greater than zero throughout t_2 ≤ t ≤ t_3.
1.0000pts
C11The response states a change in kinetic energy that is consistent with the graph drawn in part (b)(i).
1.0000pts
C12The response correctly explains why kinetic energy is increasing, by stating that positive work is done on the block, an external force increases the block’s velocity and kinetic energy, or conserved mechanical energy and decreasing potential energy transfer energy to kinetic energy.
1.0000pts
C13The response correctly explains why the kinetic-energy graph is nonlinear, by relating the changing slope to a changing rate of work or by stating that a changing external force causes a nonuniform velocity change and therefore a nonuniform kinetic-energy change.
1.0000pts
C14The response selects f_2ℓ < f_ℓ and attempts a relevant justification.
1.0000pts
C15The response correctly applies the pendulum relation T = 2π√(ℓ/g), or an equivalent equation relating pendulum length to period or frequency, and uses the inverse relationship between frequency and period.
1.0000pts
Dependencies (0)
Page Mapping (4)
Visual Preview
3 boxes
Draw, drag, resize. Advanced coordinates are available if needed.
1
2
3
Select a box to edit its role and metadata.
Attribution
This material is the intellectual property of College Board, is not owned by GradeThis, and is shown here for ease of use and demonstration purposes.