2024 AP Physics C: Electricity and Magnetism Free-Response Questions
Advanced PlacementAP Physics C: Electricity and MagnetismFree ResponseScience
3 questions45 pts
3 gradable45 rubric criteria0 dependencies
q1Question 1
q1
Question 1
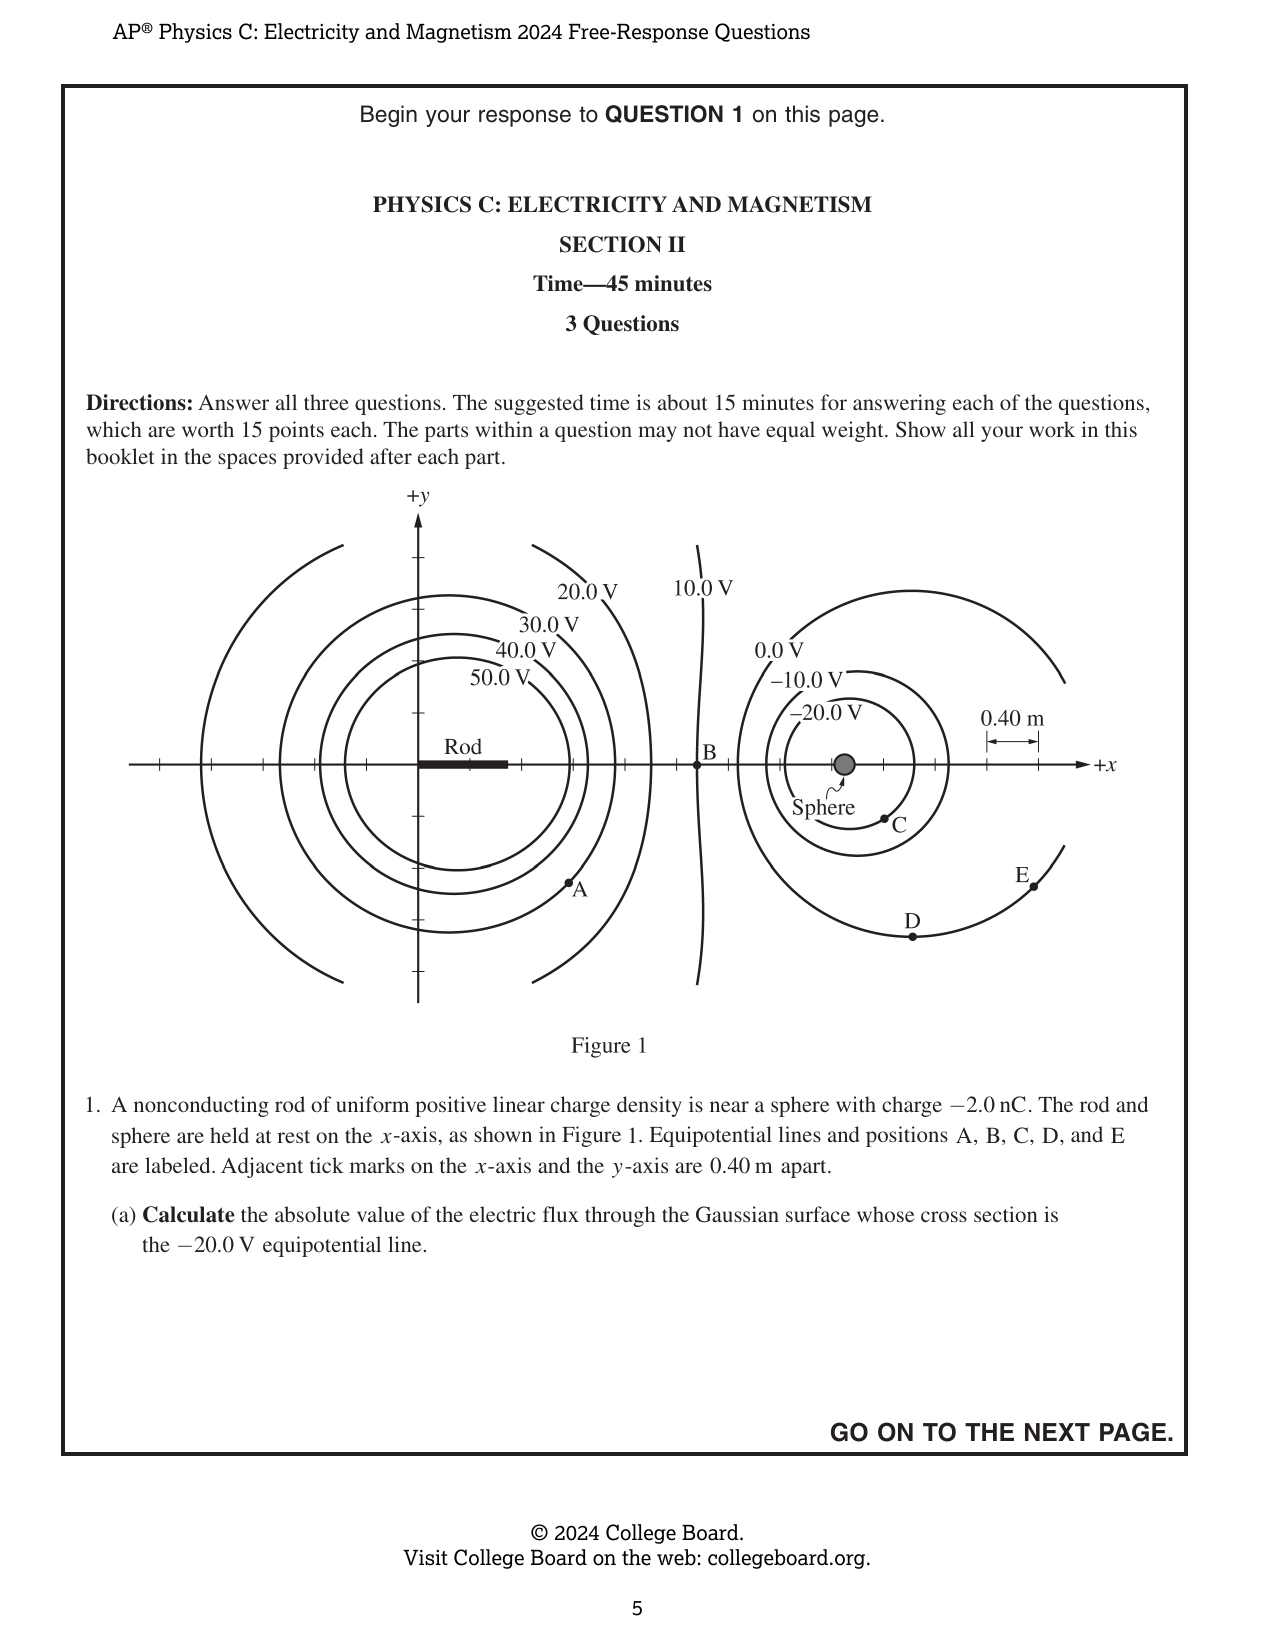
Directions: Answer all three questions. The suggested time is about 15 minutes for answering each of the questions, which are worth 15 points each. The parts within a question may not have equal weight. Show all your work in this booklet in the spaces provided after each part. Figure 1 1. A nonconducting rod of uniform positive linear charge density is near a sphere with charge −2.0 nC. The rod and sphere are held at rest on the x-axis, as shown in Figure 1. Equipotential lines and positions A, B, C, D, and E are labeled. Adjacent tick marks on the x-axis and the y-axis are 0.40 m apart. (a) Calculate the absolute value of the electric flux through the Gaussian surface whose cross section is the −20.0 V equipotential line. A positive test charge (not shown) is placed and held at rest at Position C. An external force is applied to the test charge to move the test charge to different positions in the order of C→E→D→A. The test charge is momentarily held at rest at each position. (b) The bar shown in Figure 2 represents the absolute value of the work W_CE done by the external force on the test charge to move the test charge from Position C to Position E. i. Complete the following tasks on Figure 2. • Draw a bar to represent the relative absolute value of the work W_ED done by the external force on the test charge to move the test charge from Position E to Position D. • Draw a bar to represent the relative absolute value of the work W_DA done by the external force on the test charge to move the test charge from Position D to Position A. • The height of each bar should be proportional to the value of W_CE. If W_ED = 0 and/or W_DA = 0, write a "0" in the corresponding columns, as appropriate. Figure 2 ii. Calculate the approximate magnitude of the x-component of the electric field at Position B. The positive test charge is placed at Position D. The test charge is then released from rest. (c) Indicate the direction (not components) of the net electric force exerted on the test charge immediately after the test charge is released from rest. ___ +x ___ +y ___ Directly away from the sphere ___ −x ___ −y ___ Directly toward the sphere Without using equations, justify your answer using physics principles. Figure 3 The sphere and the test charge are removed. The rod has length 4L and uniform positive linear charge density +λ. The rod is held at rest on the x-axis in the orientation shown in Figure 3. Position P (not shown) is located on the x-axis a distance x_P from the origin, where x_P > 4L. (d) The electric potential V_P at x_P is V_P = kλ ln ( x_P / (x_P − 4L) ). i. Using integral calculus, derive the expression for V_P provided. ii. On Figure 4, sketch a graph of the x-component E_x of the electric field from the rod as a function of x in the region 4L < x < 12L. Figure 4
Rubric Criteria (15)
C1For using a correct equation for electric flux.
1.0000pts
C2For the correct numerical answer for the electric flux. The response may include a negative sign in the final answer or have missing and/or incorrect units and still earn this point.
1.0000pts
C3For indicating that W_ED = 0.
1.0000pts
C4For drawing a bar representing W_DA that has a height of six units.
1.0000pts
C5For using an equation that relates the electric field to potential difference. This point can be earned if the response begins with a correct relationship between electric field and potential difference in which numerical values are already substituted.
1.0000pts
C6For correct substitutions of values of electric potential and the distance between equipotential lines that can be used to calculate the approximate magnitude of the electric field at Position B.
1.0000pts
C7For selecting only +y with an attempt at a relevant justification.
1.0000pts
C8For indicating that the direction of the electric field vector is perpendicular to a line that is tangent to the equipotential line at Position D.
1.0000pts
C9For indicating one of the following: the test charge moves from a higher electric potential to a lower electric potential; the test charge and the sphere have charges of opposite sign; or the test charge moves in the direction of the electric field, which is directed upward.
1.0000pts
C10For using an appropriate equation for determining the electric potential from a line of uniform charge.
1.0000pts
C11For a correct determination of r, the distance between Point P and a point on the line of uniform charge.
1.0000pts
C12For a correct integral with λ dx substituted for dq.
1.0000pts
C13For the correct limits of integration.
1.0000pts
C14For sketching a curve or line that continually approaches the horizontal axis as position increases.
1.0000pts
C15For sketching a concave up curve that is always positive.
1.0000pts
Dependencies (0)
Page Mapping (5)
Visual Preview
5 boxes
Draw, drag, resize. Advanced coordinates are available if needed.
1
2
3
4
5
Select a box to edit its role and metadata.
Attribution
This material is the intellectual property of College Board, is not owned by GradeThis, and is shown here for ease of use and demonstration purposes.