2023 AP Physics C: Electricity and Magnetism Free-Response Questions
Advanced PlacementAP Physics C: Electricity and MagnetismFree ResponseScience
3 questions45 pts
3 gradable45 rubric criteria0 dependencies
q1Question 1
q1
Question 1
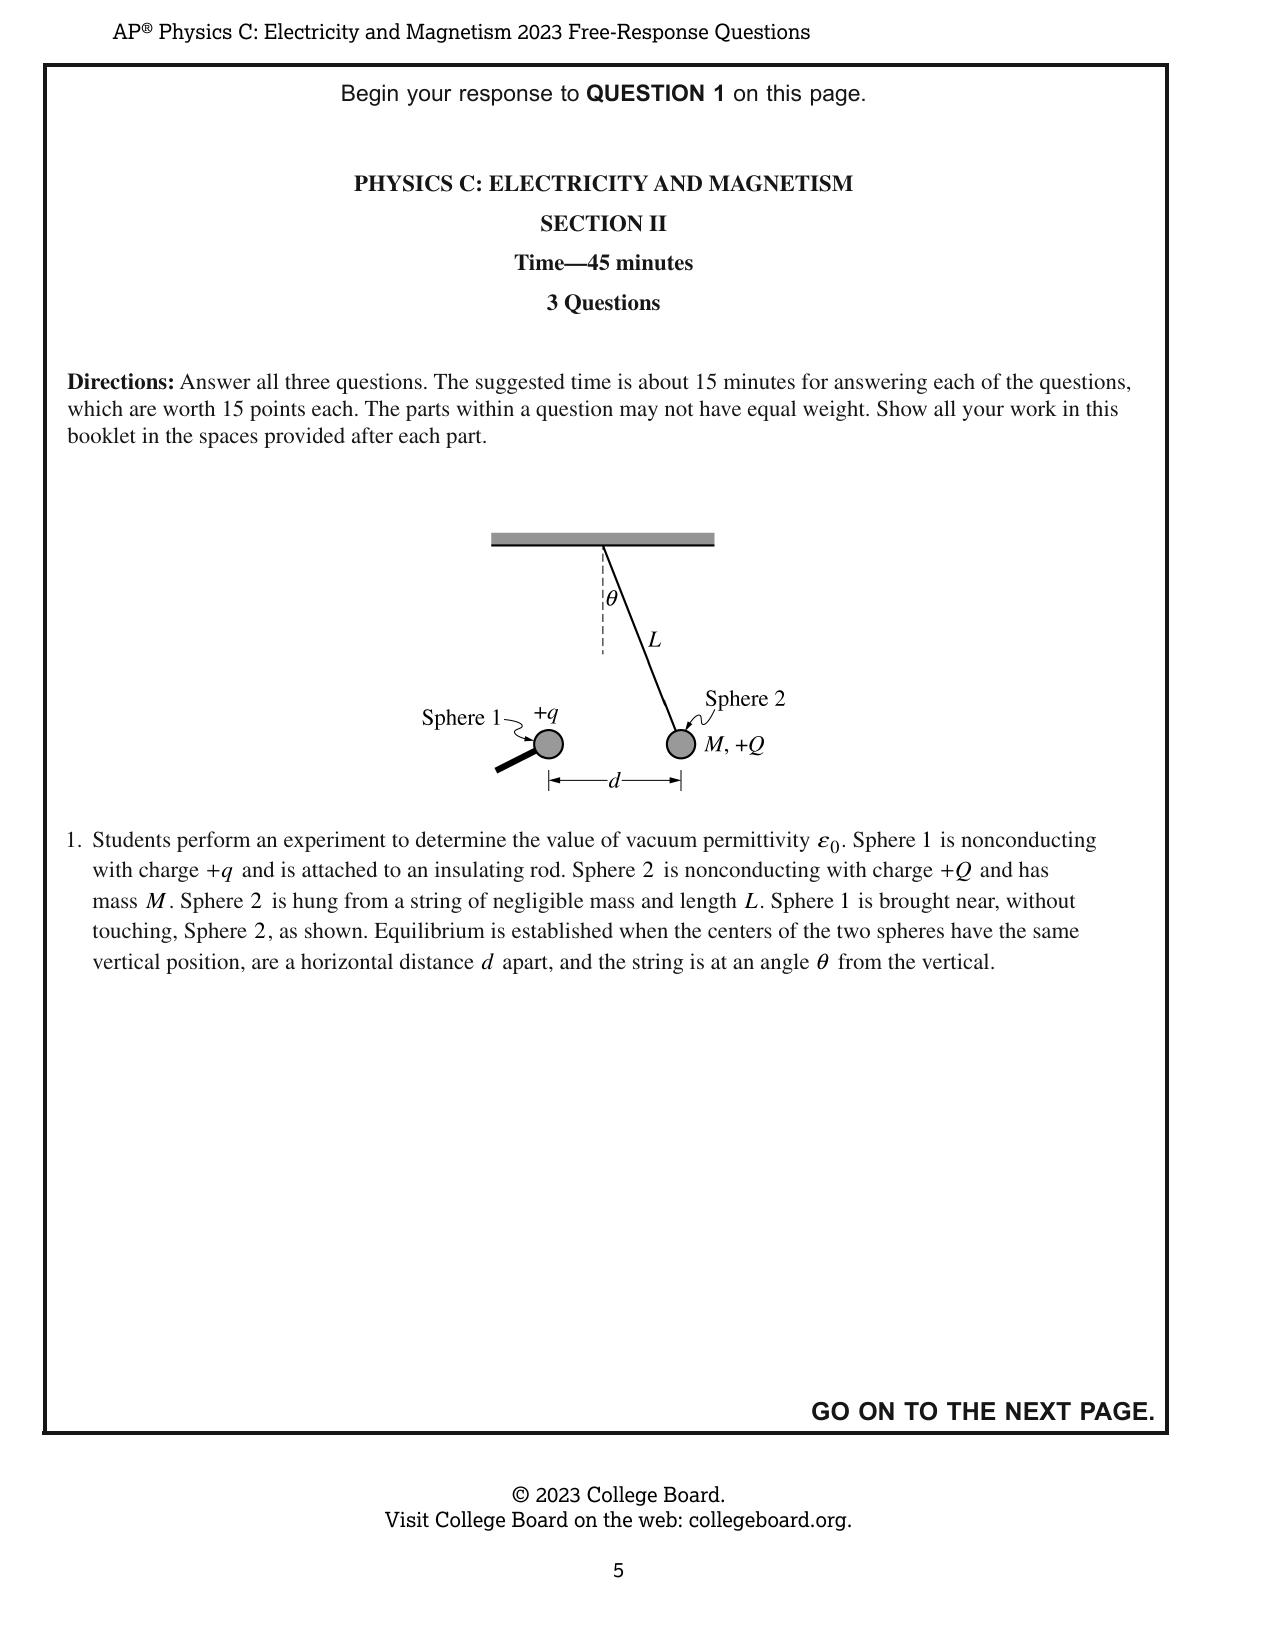
Directions: Answer all three questions. The suggested time is about 15 minutes for answering each of the questions, which are worth 15 points each. The parts within a question may not have equal weight. Show all your work in this booklet in the spaces provided after each part. 1. Students perform an experiment to determine the value of vacuum permittivity ε₀. Sphere 1 is nonconducting with charge +q and is attached to an insulating rod. Sphere 2 is nonconducting with charge +Q and has mass M. Sphere 2 is hung from a string of negligible mass and length L. Sphere 1 is brought near, without touching, Sphere 2, as shown. Equilibrium is established when the centers of the two spheres have the same vertical position, are a horizontal distance d apart, and the string is at an angle θ from the vertical. [Figure: Sphere 1, labeled +q, is on an insulating rod to the left of Sphere 2. Sphere 2 is labeled M, +Q, and is suspended by a string of length L. The centers are separated horizontally by d, and the string makes angle θ from the vertical.] (a) On the following dot that represents Sphere 2 at the position shown in the previous figure, draw and label the forces (not components) that act on Sphere 2. Each force must be represented by a distinct arrow starting on, and pointing away from, the dot. (b) Derive the relationship between the distance d and the angle θ to show that d = √(Qq/(4πε₀Mg tanθ)). (c) These values are collected in one trial: Q = q = 6.0 × 10⁻⁸ C, θ = 12°, and d = 0.057 m. Calculate the expected force of tension exerted on Sphere 2 by the string. (d) The students vary d and measure θ after equilibrium is reached. The students use the collected data to plot the following graph of d² vs. 1/tanθ. [Graph: d² (m²) versus 1/tanθ, with plotted data points.] i. Draw the best-fit line for the data. ii. Using the best-fit line, calculate an experimental value for the vacuum permittivity ε₀ when M = 0.0050 kg and Q = q = 6.0 × 10⁻⁸ C. (e) The students modify the experiment by replacing Sphere 1 with a conducting Sphere 3 that has the same size and charge +q. The experiment is repeated. i. The circle in the following figure represents Sphere 3 when spheres 2 and 3 are at equilibrium. On the circle, draw a single “+” sign to represent the location of highest concentration of the excess positive charges. [Figure: A circle labeled Sphere 3 attached to an insulating rod, with space on the circle for a single plus sign.] ii. Briefly explain your reasoning for the sketch drawn in part (e)(i). iii. In the original experiment, when the centers of the two spheres are a horizontal distance d₁ apart, the string makes an angle θ₁ from the vertical. In the modified experiment, when the centers of the two spheres are a horizontal distance d₁ apart, the string makes an angle θ₂ from the vertical. Is θ₂ greater than, less than, or equal to θ₁? _____ θ₂ > θ₁ _____ θ₂ < θ₁ _____ θ₂ = θ₁ Briefly justify your answer.
Rubric Criteria (15)
a1The response draws and labels the electrostatic force directed to the right.
1.0000pts
a2The response draws the tension force directed up and to the left and the gravitational force directed downward. Extraneous forces may be included, but no more than 1 point may be earned for part (a) if extraneous forces are included.
1.0000pts
b1The response equates the horizontal component of the tension force to the electrostatic force.
1.0000pts
b2The response equates the vertical component of the tension force to the gravitational force, such as by writing F_T cos(theta) = Mg.
1.0000pts
b3The response attempts to solve the horizontal- and vertical-force equations simultaneously.
1.0000pts
c1The response applies Coulomb’s law to determine the tension, using the horizontal component of tension or, alternatively, the vertical component of tension.
1.0000pts
c2The response correctly substitutes values into an expression for tension consistent with part (b), or gives a correct expression for tension.
1.0000pts
diThe response draws a line that approximates the trend of the data.
1.0000pts
dii1The response uses two points from the student’s trend line to calculate the slope. Data points may be used only when they lie directly on the drawn line.
1.0000pts
dii2The response correctly relates the graph’s slope to d^2 = [Qq/(4π ε0 M g)] [1/tan(theta)], so that the slope equals Qq/(4π ε0 M g).
1.0000pts
dii3The response substitutes the graph’s slope into ε0 = Qq/[4π M g (slope)] to calculate an experimental value of ε0.
1.0000pts
eiThe response draws a plus sign on the left side of Sphere 3.
1.0000pts
eiiThe response states that the charge on Sphere 3 rearranges because of the electric forces from the charges on Sphere 2, specifically that negative charges move to the right and leave a net positive charge on the left side of Sphere 3.
1.0000pts
eiii1The response selects theta2 < theta1 and gives a relevant justification. The answer may be consistent with the location of the excess positive charges drawn in part (e)(i).
1.0000pts
eiii2The response states that either the average distance between the repulsive charges is greater or the electrostatic/repulsive force is less. The answer may be consistent with the location of the excess positive charges drawn in part (e)(i).
1.0000pts
Dependencies (0)
Page Mapping (4)
Visual Preview
3 boxes
Draw, drag, resize. Advanced coordinates are available if needed.
1
2
3
Select a box to edit its role and metadata.
Attribution
This material is the intellectual property of College Board, is not owned by GradeThis, and is shown here for ease of use and demonstration purposes.