2024 AP Physics 2: Algebra-Based Free-Response Questions
Advanced PlacementAP Physics 2Free ResponseScience
4 questions44 pts
4 gradable44 rubric criteria0 dependencies
q1Question 1
q1
Question 1
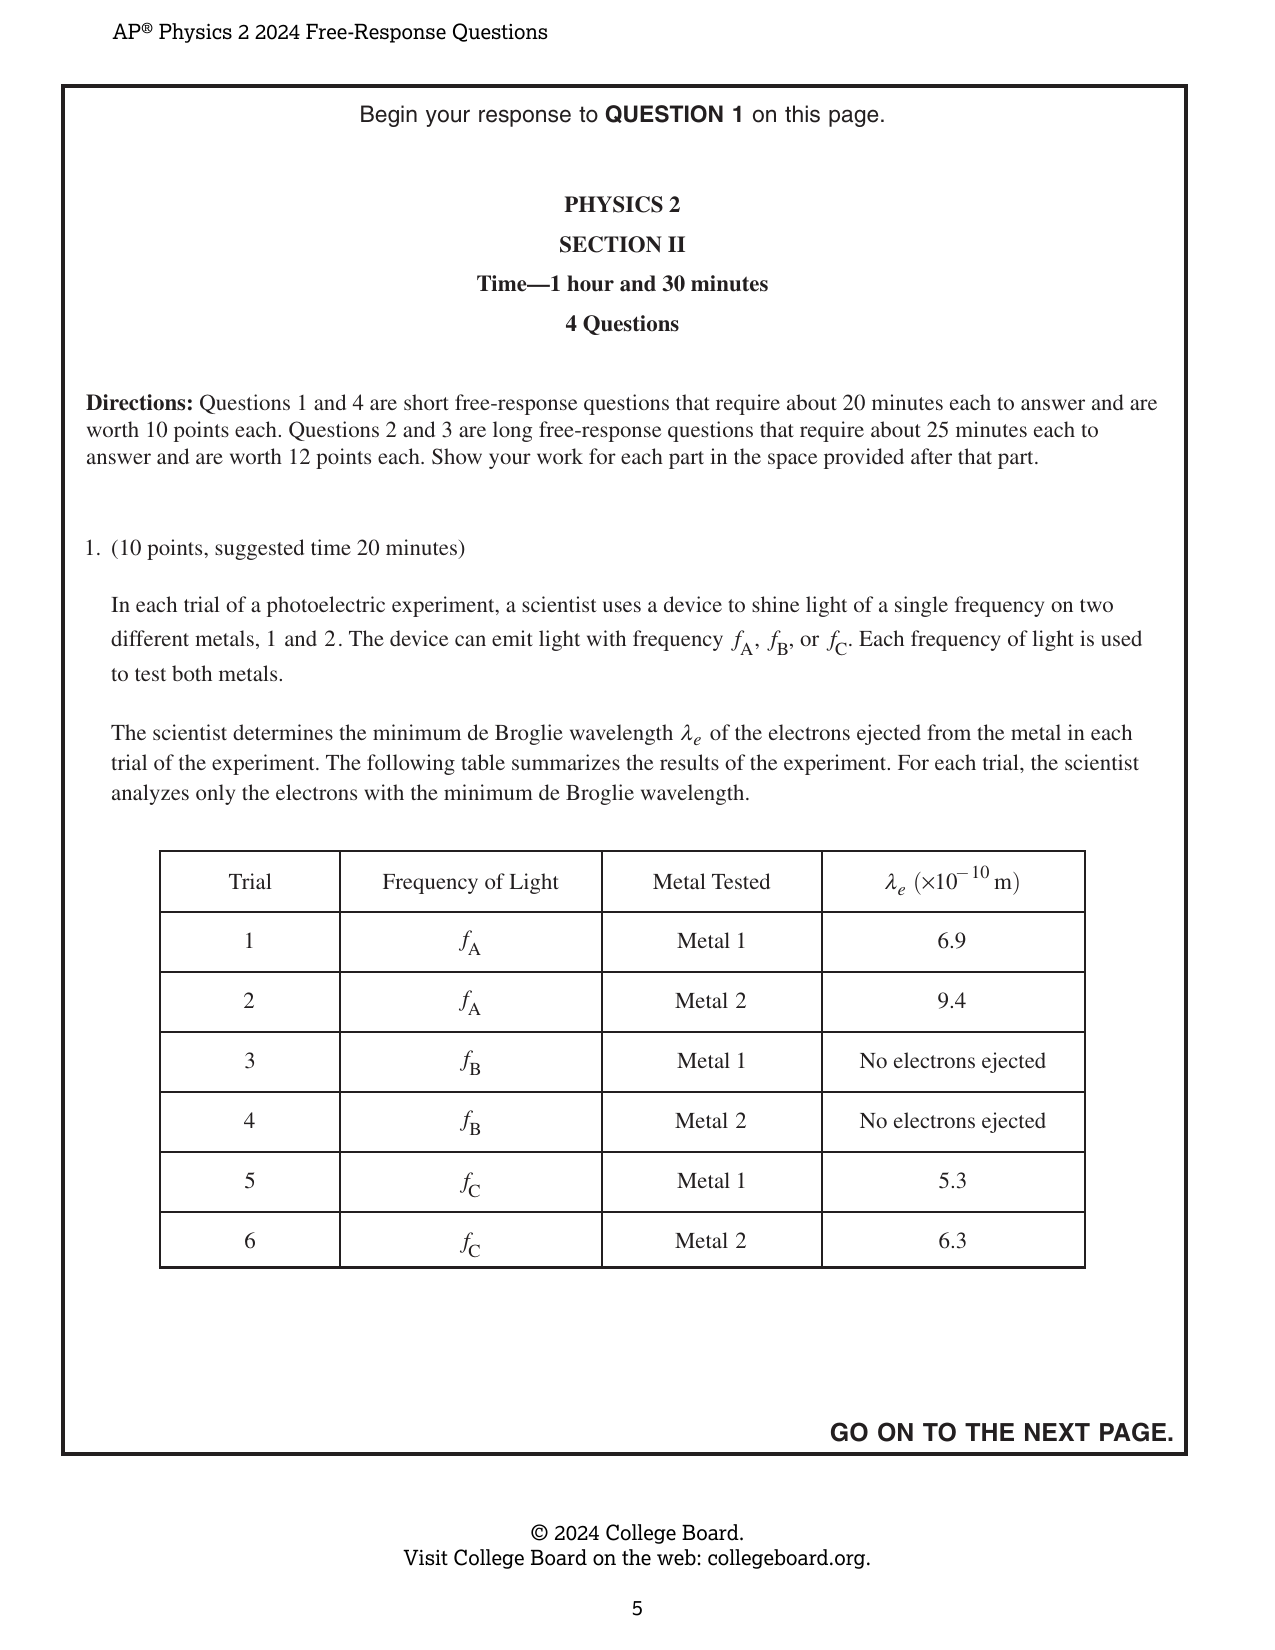
Directions: Questions 1 and 4 are short free-response questions that require about 20 minutes each to answer and are worth 10 points each. Questions 2 and 3 are long free-response questions that require about 25 minutes each to answer and are worth 12 points each. Show your work for each part in the space provided after that part. 1. (10 points, suggested time 20 minutes) In each trial of a photoelectric experiment, a scientist uses a device to shine light of a single frequency on two different metals, 1 and 2. The device can emit light with frequency $f_{\mathrm{A}}$, $f_{\mathrm{B}}$, or $f_{\mathrm{C}}$. Each frequency of light is used to test both metals. The scientist determines the minimum de Broglie wavelength $\lambda_{e}$ of the electrons ejected from the metal in each trial of the experiment. The following table summarizes the results of the experiment. For each trial, the scientist analyzes only the electrons with the minimum de Broglie wavelength. | Trial | Frequency of Light | Metal Tested | $\lambda_{e}$ ($\times 10^{-10}$ m) | |-------|-------------------|--------------|-------------------------------------| | 1 | $f_{\mathrm{A}}$ | Metal 1 | 6.9 | | 2 | $f_{\mathrm{A}}$ | Metal 2 | 9.4 | | 3 | $f_{\mathrm{B}}$ | Metal 1 | No electrons ejected | | 4 | $f_{\mathrm{B}}$ | Metal 2 | No electrons ejected | | 5 | $f_{\mathrm{C}}$ | Metal 1 | 5.3 | | 6 | $f_{\mathrm{C}}$ | Metal 2 | 6.3 | (a) In a coherent, paragraph-length response, indicate which frequency, $f_{\mathrm{A}}$, $f_{\mathrm{B}}$, or $f_{\mathrm{C}}$, is greatest and which frequency is least. Justify your answer using physics principles. (b) Calculate the maximum kinetic energy of the electrons ejected from Metal 1 in Trial 1. Assume that the momentum $p$ of an ejected electron can be described by the classical definition $p = mv$. (c) Indicate whether the work function of Metal 1 is greater than, less than, or equal to the work function of Metal 2. Justify your answer by referring to the table of results.
Rubric Criteria (10)
C1In part (a), the response indicates that frequency f_B is the least and frequency f_C is the greatest.
1.0000pts
C2In part (a), the response correctly relates the frequency of a photon to the energy of the photon.
1.0000pts
C3In part (a), the response indicates that the kinetic energy or speed of an ejected electron is inversely related to the de Broglie wavelength of the electron.
1.0000pts
C4In part (a), the response indicates that a greater photon energy or frequency results in a greater kinetic energy for an ejected electron, or indicates that the lowest photon energy or frequency is below the work function or threshold frequency which results in no ejected electron.
1.0000pts
C5In part (a), the response provides a logical, relevant, and internally consistent argument that addresses the required argument or question asked, and follows the guidelines described in the published requirements for the paragraph-length response.
1.0000pts
C6In part (b), the response correctly relates electron de Broglie wavelength to a correct expression that includes h, m, and ν, or relates kinetic energy to a correct expression that includes momentum and mass.
1.0000pts
C7In part (b), the response correctly substitutes an algebraic expression in terms of electron de Broglie wavelength λ_e for the electron speed or momentum into a relevant equation for kinetic energy, or substitutes a numerical value for electron speed or momentum into a relevant equation for kinetic energy.
1.0000pts
C8In part (b), the response provides a correct answer with units. An answer of 3 eV also earns this point.
1.0000pts
C9In part (c), the response indicates that the work function of Metal 1 is less than the work function of Metal 2 with an attempt at a relevant justification.
1.0000pts
C10In part (c), the response indicates at least two of the following: the correct relationship between the work function and the difference between hf and K_max; the frequency or energy of the incident photons is the same; the de Broglie wavelength is inversely related to the energy of the ejected electrons.
1.0000pts
Dependencies (0)
Page Mapping (2)
Visual Preview
6 boxes
Draw, drag, resize. Advanced coordinates are available if needed.
1
2
3
4
5
6
Select a box to edit its role and metadata.
Attribution
This material is the intellectual property of College Board, is not owned by GradeThis, and is shown here for ease of use and demonstration purposes.