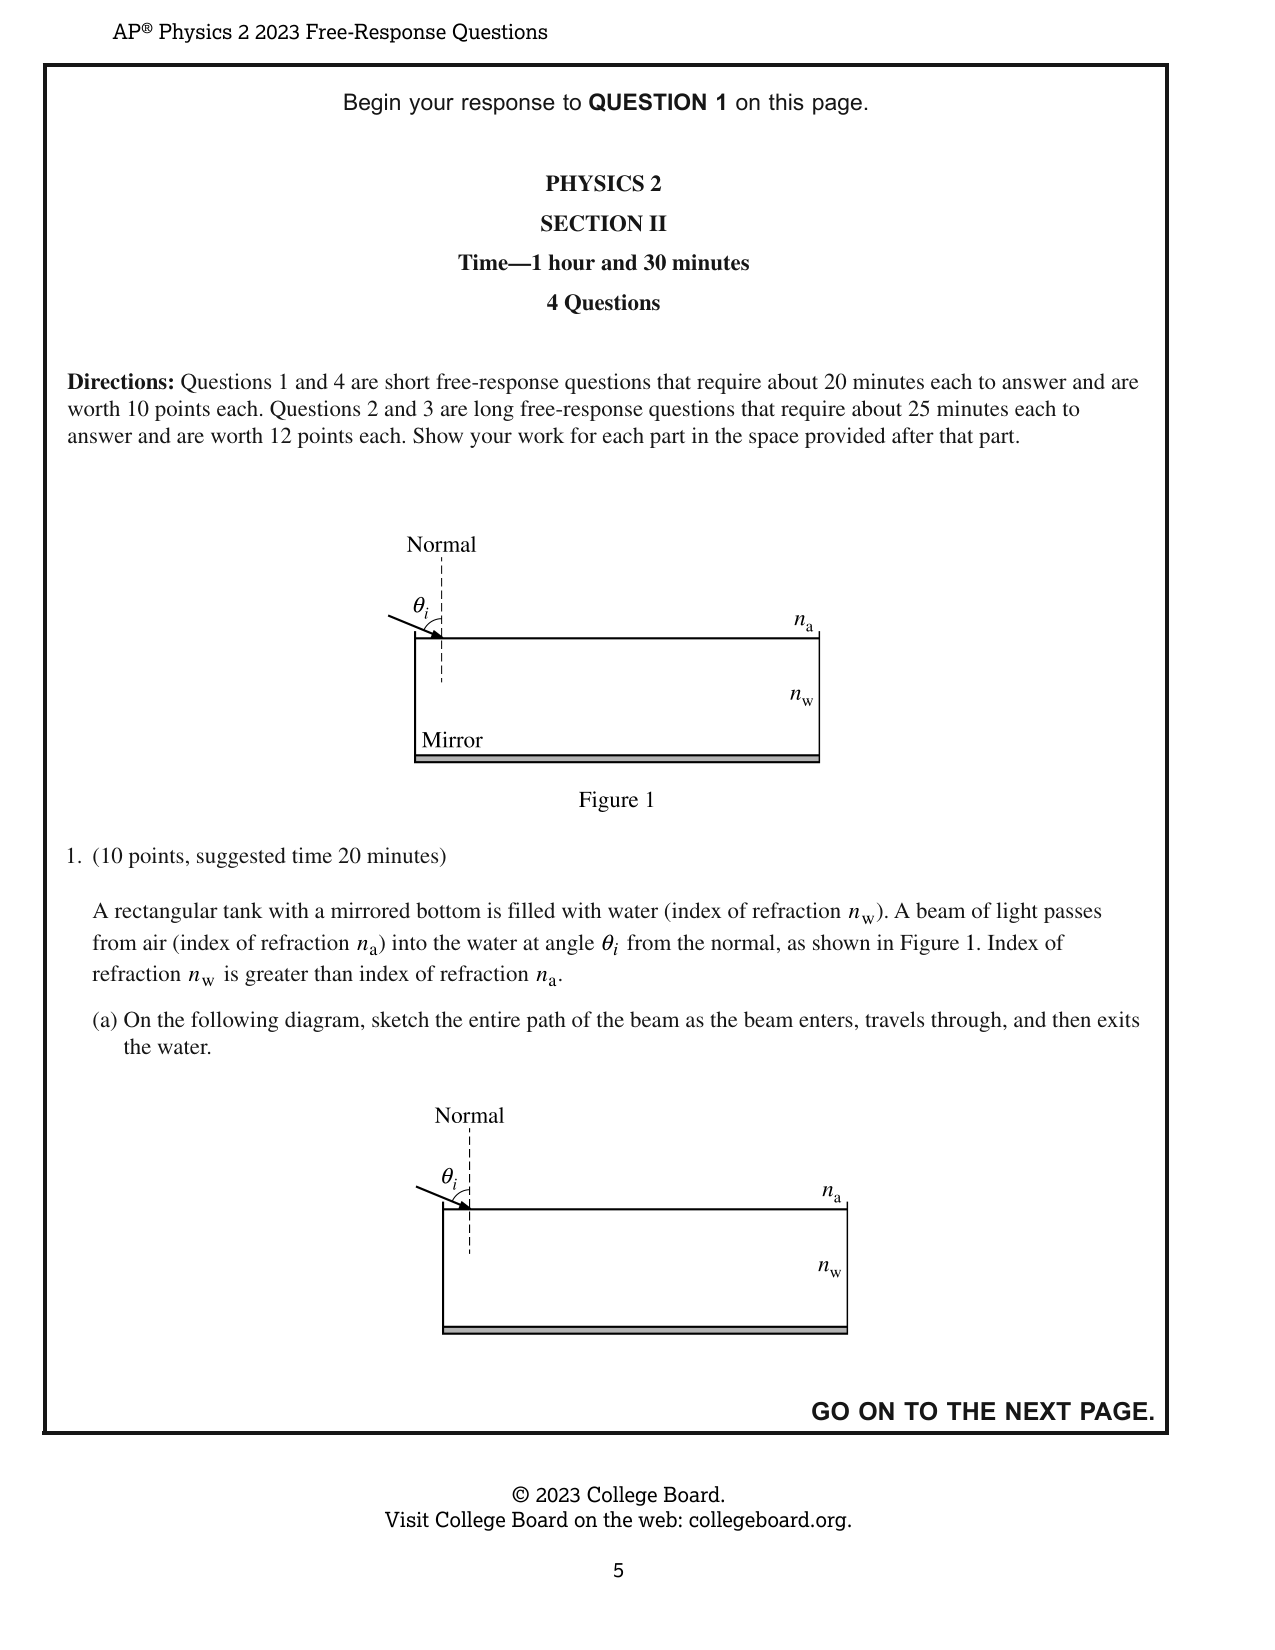
Directions: Questions 1 and 4 are short free-response questions that require about 20 minutes each to answer and are worth 10 points each. Questions 2 and 3 are long free-response questions that require about 25 minutes each to answer and are worth 12 points each. Show your work for each part in the space provided after that part. 1. (10 points, suggested time 20 minutes) A rectangular tank with a mirrored bottom is filled with water (index of refraction n_w). A beam of light passes from air (index of refraction n_a) into the water at angle θ_i from the normal, as shown in Figure 1. Index of refraction n_w is greater than index of refraction n_a. (a) On the following diagram, sketch the entire path of the beam as the beam enters, travels through, and then exits the water. Figure 2 Sugar is then added to the water, resulting in a mixture that has a different index of refraction than water. A student considers two models, Model A and Model B, for how the sugar mixes with water. The models are shown in Figure 2. Model A: The sugar is uniformly mixed throughout the water, resulting in a mixture with index of refraction n_m such that n_m > n_w. Model B: Layers are formed of varying concentrations of sugar in the water. There are three distinct layers of equal volume. The top layer is only water (index of refraction n_w). The middle layer has the same concentration of sugar as the mixture in Model A (index of refraction n_m). The bottom layer has the highest concentration of sugar (index of refraction n_b). (b) Consider Model A. Briefly describe how the observed wavelength of light changes, if at all, as the beam travels from air into the mixture. (c) Relevant angles between the beam and the normal for the various layers present in models A and B are defined in the following table. Model A | Model B θ_i | Incident angle of the beam in air | θ_i | Incident angle of the beam in air θ_1 | Angle the beam makes with the normal in the mixture in Model A | θ_2 | Angle the beam makes with the normal in the top layer in Model B | | θ_3 | Angle the beam makes with the normal in the middle layer in Model B | | θ_4 | Angle the beam makes with the normal in the bottom layer in Model B i. Determine an expression for θ_4 in terms of θ_i, n_a, and n_b. ii. Rank the angles from greatest to least, with 1 being greatest. If two angles are the same value, give them the same ranking. ____ θ_1 ____ θ_2 ____ θ_3 ____ θ_4 Briefly explain your reasoning using appropriate physics principles and/or mathematical models. For the original tank filled with water, the beam is observed to exit the surface of the water a horizontal distance d_w from the entry point. For models A and B, the horizontal distances are d_A and d_B, respectively. (d) Determine whether d_A and d_B are each greater than, less than, or equal to d_w. It is NOT necessary to compare d_A to d_B. Briefly justify your answer.
Draw, drag, resize. Advanced coordinates are available if needed.
Begin your response to QUESTION 2 on this page. 2. (12 points, suggested time 25 minutes) Students are given an unknown circuit component that is connected in series to a resistor with known resistance 500 Ω. (a) The students are asked to experimentally determine whether the component is a resistor or an uncharged capacitor. i. Complete the following diagram to show how to use standard circuit equipment to determine whether the component is a resistor or an uncharged capacitor. ii. Describe an experimental procedure to determine whether the component is a resistor or an uncharged capacitor. Refer to the circuit equipment in the diagram drawn in part (a)(i). iii. What results would the students expect if the component is an uncharged capacitor? Support your answer in terms of potential difference and charge. Continue your response to QUESTION 2 on this page. The students conduct a different experiment to determine the emf ℰ of a battery that is not ideal and has internal resistance r = 30 Ω. The battery is connected to a variable resistor in a circuit, as shown. The students measure the current I through the circuit for different values of resistance R_var of the variable resistor that is connected to the battery. The following table contains the data collected. I (A) R_var (Ω) 0.087 200 0.060 300 0.042 450 0.027 700 0.016 1200 (b) i. Write an equation describing the circuit in terms of ℰ, I, r, and R_var. ii. Which quantities could be graphed to yield a straight line that could be used to calculate a numerical value for the emf ℰ of the battery? Horizontal Axis: _______________ Vertical Axis: _______________ Continue your response to QUESTION 2 on this page. iii. Plot the data points for the quantities indicated in part (b)(ii) on the following graph. Clearly scale and label all axes, including units. Draw a straight line that best represents the data. You may use the blank columns in the table for any quantities you graph other than the given data. iv. Using the graph from part (b)(iii), determine the emf ℰ of the battery.
Draw, drag, resize. Advanced coordinates are available if needed.
Begin your response to QUESTION 3 on this page. Note: Figure not drawn to scale. Figure 1 3. (12 points, suggested time 25 minutes) Tank X is a large cylindrical tank that is partially filled with water, as shown in Figure 1. The bottom of Tank X is connected to a short horizontal pipe. A valve that is initially closed can be opened to allow water to flow through the pipe and exit through the other end of the pipe. (a) Two blocks, A and B, have identical dimensions and are placed in the tank. Both blocks float at rest and are partially submerged in the water. i. The water and air can be modeled as consisting of individual particles that are in continuous random motion. In terms of interactions with both water and air particles, explain why there is an upward buoyant force exerted on each block. ii. The valve is then opened, and water flows out through the pipe. The surface of the water moves downward. When Block A touches the bottom of Tank X, Block B is still above the bottom of Tank X. Which block has a greater density? Briefly explain your reasoning. Continue your response to QUESTION 3 on this page. Note: Figure not drawn to scale. Figure 2 Tank Y is a large tank with the top open to the air, as shown in Figure 2. The bottom of Tank Y is connected to a short horizontal pipe of radius $r$ with a closed valve. Tank Y is filled with water to height $h_0$ above the horizontal pipe. Tank Y is specially designed so that when the valve is opened, the surface of the water moves downward at constant speed $v_s$. (b) At time $t = 0$, the valve is opened. i. Derive the relationship between the speed $v_p$ at which water exits the pipe and the changing height $h$ of the surface of the water above the pipe to show that $v_p = \sqrt{v_s^2 + 2gh}$. ii. Derive the relationship between $v_p$ and the changing radius $R$ of the top surface of the water to show that $v_p = \frac{R^2}{r^2} v_s$. iii. When the radius $R$ of the tank is sufficiently greater than $r$, the speed $v_p$ can be approximated as $v_p = \sqrt{2gh}$. Justify this claim. Continue your response to QUESTION 3 on this page. Note: Figure not drawn to scale. Figure 3 Tank Z is a large tank whose top is open to the air and is shaped as shown in Figure 3. The bottom of Tank Z is connected to a short horizontal pipe with a closed valve. Tank Z is filled with water to a height $h_0$ above the horizontal pipe. At time $t = 0$, the valve of Tank Z is opened. (c) Does the speed $v_s$ at which the surface of the water moves downward increase, decrease, or remain the same over time as water exits the other end of the pipe? Justify your answer by using or referencing equations from both part (b)(i) and part (b)(ii).
Draw, drag, resize. Advanced coordinates are available if needed.
Begin your response to QUESTION 4 on this page. [Diagram: An equilateral triangle with particles A (+Q) and B (+Q) at two vertices and side length d. Point P is located equidistant from each vertex at the center of the triangle. The bottom-right vertex is indicated with a dashed open circle.] 4. (10 points, suggested time 20 minutes) Particles A and B each have positive charge +Q and are held fixed at two vertices of an equilateral triangle of side length d, as shown. Point P is located equidistant from each vertex of the triangle. Students Y and Z discuss the electric field and the electric potential at Point P after a third charged particle is placed at the bottom-right vertex. The students make the following statements. Student Y: "If a particle with positive charge +2Q is placed at the bottom-right vertex, the magnitude of the electric field will be zero at Point P." Student Z: "To make the value of the electric potential zero at Point P, a particle with negative charge -Q should be placed at the bottom-right vertex." (a) In a coherent, paragraph-length response, evaluate the accuracy of each student's statement. If any aspect of either student's statement is inaccurate, explain how to correct the student's statement. Support your evaluations using appropriate physics principles. Continue your response to QUESTION 4 on this page. (b) Particles A and B are once again held in place at two vertices of the equilateral triangle. The students want to represent the electric potential energy of a system of particles when a third charged particle is brought from very far away to the bottom-right vertex. Scenarios 1 and 2 are considered. i. In Scenario 1, a third particle with positive charge +Q is moved from very far away to the bottom-right vertex and then held in place. A bar is shown on the following chart that represents the electric potential energy U_{i1} of the system consisting of all three particles when the third particle with positive charge is very far away from the other particles. In the grid provided, complete the bar chart. • Draw a bar to represent the work W_1 required to move the third particle with positive charge from very far away to the bottom-right vertex. • Draw another bar to represent the electric potential energy U_{f1} of the system consisting of all three particles when the third particle with positive charge is held in place at the bottom-right vertex. The height of each bar should be proportional to the energy represented. If the quantity is zero, write a "0" in that column. [Bar chart for Scenario 1: Three columns labeled U_{i1}, W_1, and U_{f1}. A bar is shown in the U_{i1} column.] Scenario 1 Continue your response to QUESTION 4 on this page. ii. In Scenario 2, a particle with negative charge -Q is moved from very far away to the bottom-right vertex and then held in place. A bar is shown on the following chart that represents the electric potential energy U_{i2} of the system consisting of all three particles when the particle with negative charge is very far away from the other particles. In the grid provided, complete the bar chart. • Draw a bar to represent the work W_2 required to move the particle with negative charge from very far away to the bottom-right vertex. • Draw another bar to represent the electric potential energy U_{f2} of the system consisting of all three particles when the particle with negative charge is held in place at the bottom-right vertex. The height of each bar should be proportional to the energy represented. If the quantity is zero, write a "0" in that column. [Bar chart for Scenario 2: Three columns labeled U_{i2}, W_2, and U_{f2}. A bar is shown in the U_{i2} column.] Scenario 2
Draw, drag, resize. Advanced coordinates are available if needed.
This material is the intellectual property of College Board, is not owned by GradeThis, and is shown here for ease of use and demonstration purposes.