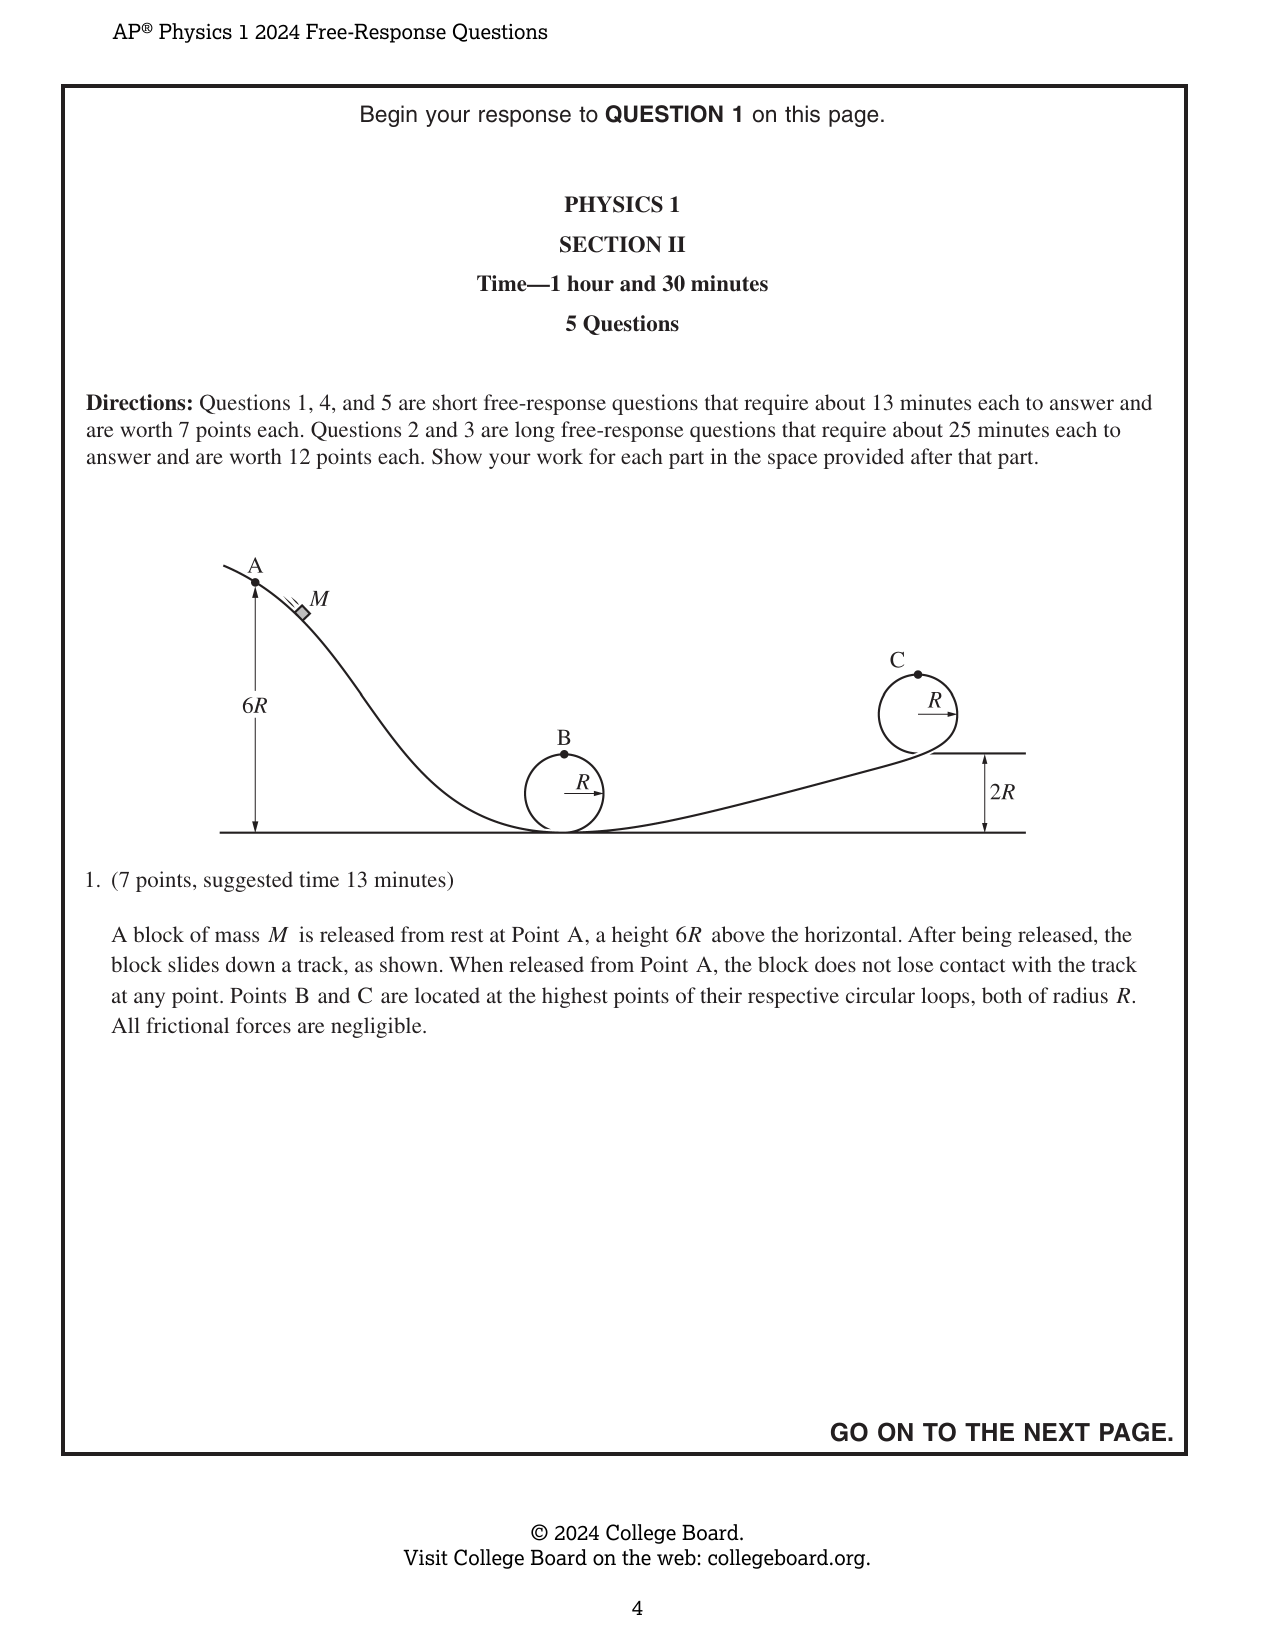
Directions: Questions 1, 4, and 5 are short free-response questions that require about 13 minutes each to answer and are worth 7 points each. Questions 2 and 3 are long free-response questions that require about 25 minutes each to answer and are worth 12 points each. Show your work for each part in the space provided after that part. 1. (7 points, suggested time 13 minutes) A block of mass M is released from rest at Point A, a height 6R above the horizontal. After being released, the block slides down a track, as shown. When released from Point A, the block does not lose contact with the track at any point. Points B and C are located at the highest points of their respective circular loops, both of radius R. All frictional forces are negligible. Diagram A shows an energy bar chart that represents the gravitational potential energy U_g of the block-Earth system and the kinetic energy K of the block at Point A, when the block is released from rest at height 6R. (a) Draw shaded regions in Diagram B that represent the gravitational potential energy U_g and kinetic energy K of the block-Earth system when the block is located at Point B, a height 2R above the horizontal. - Shaded regions should start at the dashed line that represents zero energy. - Represent any energy that is equal to zero with a distinct line on the zero-energy line. - The relative height of each shaded region should reflect the magnitude of the respective energy consistent with the scale shown in Diagram A. (b) Starting with conservation of energy, derive an expression for the speed of the block at Point B. Express your answer in terms of R and physical constants, as appropriate. Begin your derivation by writing a fundamental physics principle or an equation from the reference book. (c) i. On the following dot that represents the block, draw and label the forces (not components) that are exerted on the block at the instant the block slides through Point C. Each force must be represented by a distinct arrow starting on, and pointing away from, the dot. ii. A student claims that 4R is the minimum height of Point A, such that the block can slide through Point C without losing contact with the track after the block is released from rest. Briefly explain why this claim is incorrect.
Draw, drag, resize. Advanced coordinates are available if needed.
Begin your response to QUESTION 2 on this page. 2. (12 points, suggested time 25 minutes) A student hangs a spring of unknown spring constant $k$ vertically by attaching one end to a stand, as shown in Figure 1. The other end of the spring has a small loop from which small cylinders can be hung. In addition to the spring, the student has access only to a variety of cylinders of unknown masses, a stopwatch, and a digital scale. (a) Design an experimental procedure the student could use to determine the spring constant $k$ of the spring. In the following table, list the quantities that would be measured using only the provided equipment in your experiment. Define a symbol to represent each quantity. In the space below the table, describe the overall procedure. Provide enough detail so that another student could replicate the experiment, including any steps necessary to reduce experimental uncertainty. As needed, use the symbols defined in the table. If needed, you may include a simple diagram of the setup with your procedure. Continue your response to QUESTION 2 on this page. | Quantity to Be Measured | Symbol for Quantity | Equipment for Measurement | | | | Stopwatch | | | | Digital scale | | | | | | Procedure (and diagram, if needed) | | | (b) i. Indicate the quantities that could be plotted to produce a linear graph whose slope can be used to determine the spring constant $k$ of the spring. Vertical axis: ___ Horizontal axis: ___ ii. Briefly describe how the slope of the graph would be analyzed to determine the spring constant $k$ of the spring. Continue your response to QUESTION 2 on this page. In a different experiment, the student attaches one end of a spring to a force sensor that is attached to a wall. The other end of the spring is attached to a cart with mass $m = 0.25$ kg. The student places a motion detector to the right of the cart, as shown in Figure 2, and pulls the cart to the right a small distance so that the spring is stretched. The student releases the cart from rest, and the cart-spring system oscillates. The following graphs show the velocity $v$ of the cart and the force $F$ exerted on the cart by the spring as functions of time $t$. Continue your response to QUESTION 2 on this page. (c) i. Using the data in the velocity-time graph, calculate the change in kinetic energy of the cart from $t = 0.5$ s to $t = 2.0$ s. Show your steps and substitutions. ii. Using the data in the force-time graph, estimate the change in momentum of the cart from $t = 0.5$ s to $t = 2.5$ s. Briefly explain how you arrived at your estimation. iii. Do the data from the velocity-time graph confirm your estimation from part (c)(ii) ? Briefly explain. GO ON TO THE NEXT PAGE.
Draw, drag, resize. Advanced coordinates are available if needed.
Begin your response to QUESTION 3 on this page. Figure 1 3. (12 points, suggested time 25 minutes) The left end of a uniform beam of mass M and length L is attached to a wall by a hinge, as shown in Figure 1. One end of a string with negligible mass is attached to the right end of the beam. The other end of the string is attached to the wall above the hinge at Point 1. The beam remains horizontal. The hinge exerts a force on the beam of magnitude F_H, and the angle between the beam and the string is θ = θ_1. (a) The following rectangle represents the beam in Figure 1. On the rectangle, draw and label the forces (not components) exerted on the beam. Draw each force as a distinct arrow starting on, and pointing away from, the point at which the force is exerted. Continue your response to QUESTION 3 on this page. Figure 2 (b) The string is then attached lower on the wall, at Point 2, and the beam remains horizontal, as shown in Figure 2. The angle between the beam and the string is θ = θ_2. The dashed line represents the string shown in Figure 1. The magnitude of the tension in the string shown in Figure 1 is F_T1. The magnitude of the tension in the string shown in Figure 2 is F_T2. Indicate which of the following correctly compares F_T2 with F_T1. ____ F_T2 > F_T1 ____ F_T2 < F_T1 ____ F_T2 = F_T1 Briefly justify your answer, using qualitative reasoning beyond referencing equations. (c) Starting with Newton's second law in rotational form, derive an expression for the magnitude of the tension in the string. Express your answer in terms of M, θ, and physical constants, as appropriate. Begin your derivation by writing a fundamental physics principle or an equation from the reference book. Continue your response to QUESTION 3 on this page. (d) Is your derived equation in part (c) consistent with your justification in part (b)? Explain your reasoning. (e) The string is cut, and the beam begins to rotate about the hinge with negligible friction. On the following axes, sketch the angular speed of the beam as a function of time for the time interval while the beam falls but before the beam becomes vertical. Axes are provided with the vertical axis labeled Angular Speed and the horizontal axis labeled Time, with origin O.
Draw, drag, resize. Advanced coordinates are available if needed.
4. (7 points, suggested time 13 minutes) A simple pendulum consists of a small sphere that hangs from a string with negligible mass. The top end of the string is fixed. The sphere is pulled to Point A so that the string makes a small angle θ with the vertical, as shown. The sphere is then released from rest and swings through its lowest point at Point B. The work done on the sphere by Earth between points A and B is W_E. The pendulum is then taken to Planet X. The mass of Planet X is the same as the mass of Earth, but the radius of Planet X is greater than the radius of Earth. The sphere is again brought to Point A (displaced θ from the vertical), released from rest, and swings through its lowest point at Point B. The work done on the sphere by Planet X between points A and B is W_X. (a) Justify why W_X is less than W_E. A new pendulum is made by hanging the same small sphere from a different string with negligible mass. The new string is slightly elastic, and the length of the string may increase or decrease depending on the tension applied to the string. On Earth, when the sphere is again displaced θ from the vertical and released from rest, the new pendulum oscillates with period T_E. The new pendulum is then taken to a different planet, Planet Y. The radius of Planet Y is the same as the radius of Earth, but the mass of Planet Y is larger than the mass of Earth. On Planet Y, when the sphere is again displaced from the vertical and released from rest, the new pendulum oscillates with period T_Y. (b) In a clear, coherent paragraph-length response that may also contain drawings, explain how T_Y could be larger than T_E but also could be smaller than T_E.
Draw, drag, resize. Advanced coordinates are available if needed.
Begin your response to QUESTION 5 on this page. Figure 1 shows Block A (labeled 6 kg) sliding toward Block B (labeled 2 kg) along a horizontal surface at t = 0. 5. (7 points, suggested time 13 minutes) At time t = 0, Block A slides along a horizontal surface toward Block B, which is initially at rest, as shown in Figure 1. The masses of blocks A and B are 6 kg and 2 kg, respectively. The blocks collide elastically at t = 1.0 s, and as a result, the magnitude of the change in kinetic energy of Block B is 9 J. All frictional forces are negligible. (a) Determine the speed of Block B immediately after the collision. Continue your response to QUESTION 5 on this page. Figure 2 shows a graph of position x (m) versus time t (s). Between t = 0 and t = 1.0 s, Block B remains at x = 2 m, Block A moves from x = 0 to x = 2 m, and the center of mass of the two-block system moves along a dashed line from x ≈ 0.5 m to x = 2.0 m. The graph shown in Figure 2 represents the positions x of Block A, Block B, and the center of mass of the two-block system as functions of t between t = 0 and t = 1.0 s. (b) On the graph in Figure 2, draw and label three lines to represent the positions of Block A, Block B, and the center of mass of the two-block system as functions of t between t = 1.0 s and t = 2.0 s. Each line should be distinctly labeled. (c) Consider if in the original scenario, instead of colliding elastically, the blocks collided and stuck together. Describe how the line drawn for the center of mass in part (b) would change, if at all. Briefly justify your response.
Draw, drag, resize. Advanced coordinates are available if needed.
This material is the intellectual property of College Board, is not owned by GradeThis, and is shown here for ease of use and demonstration purposes.