2023 AP Physics C: Mechanics Free-Response Questions
Advanced PlacementAP Physics C: MechanicsFree ResponseScience
3 questions45 pts
3 gradable45 rubric criteria0 dependencies
q1Question 1
q1
Question 1
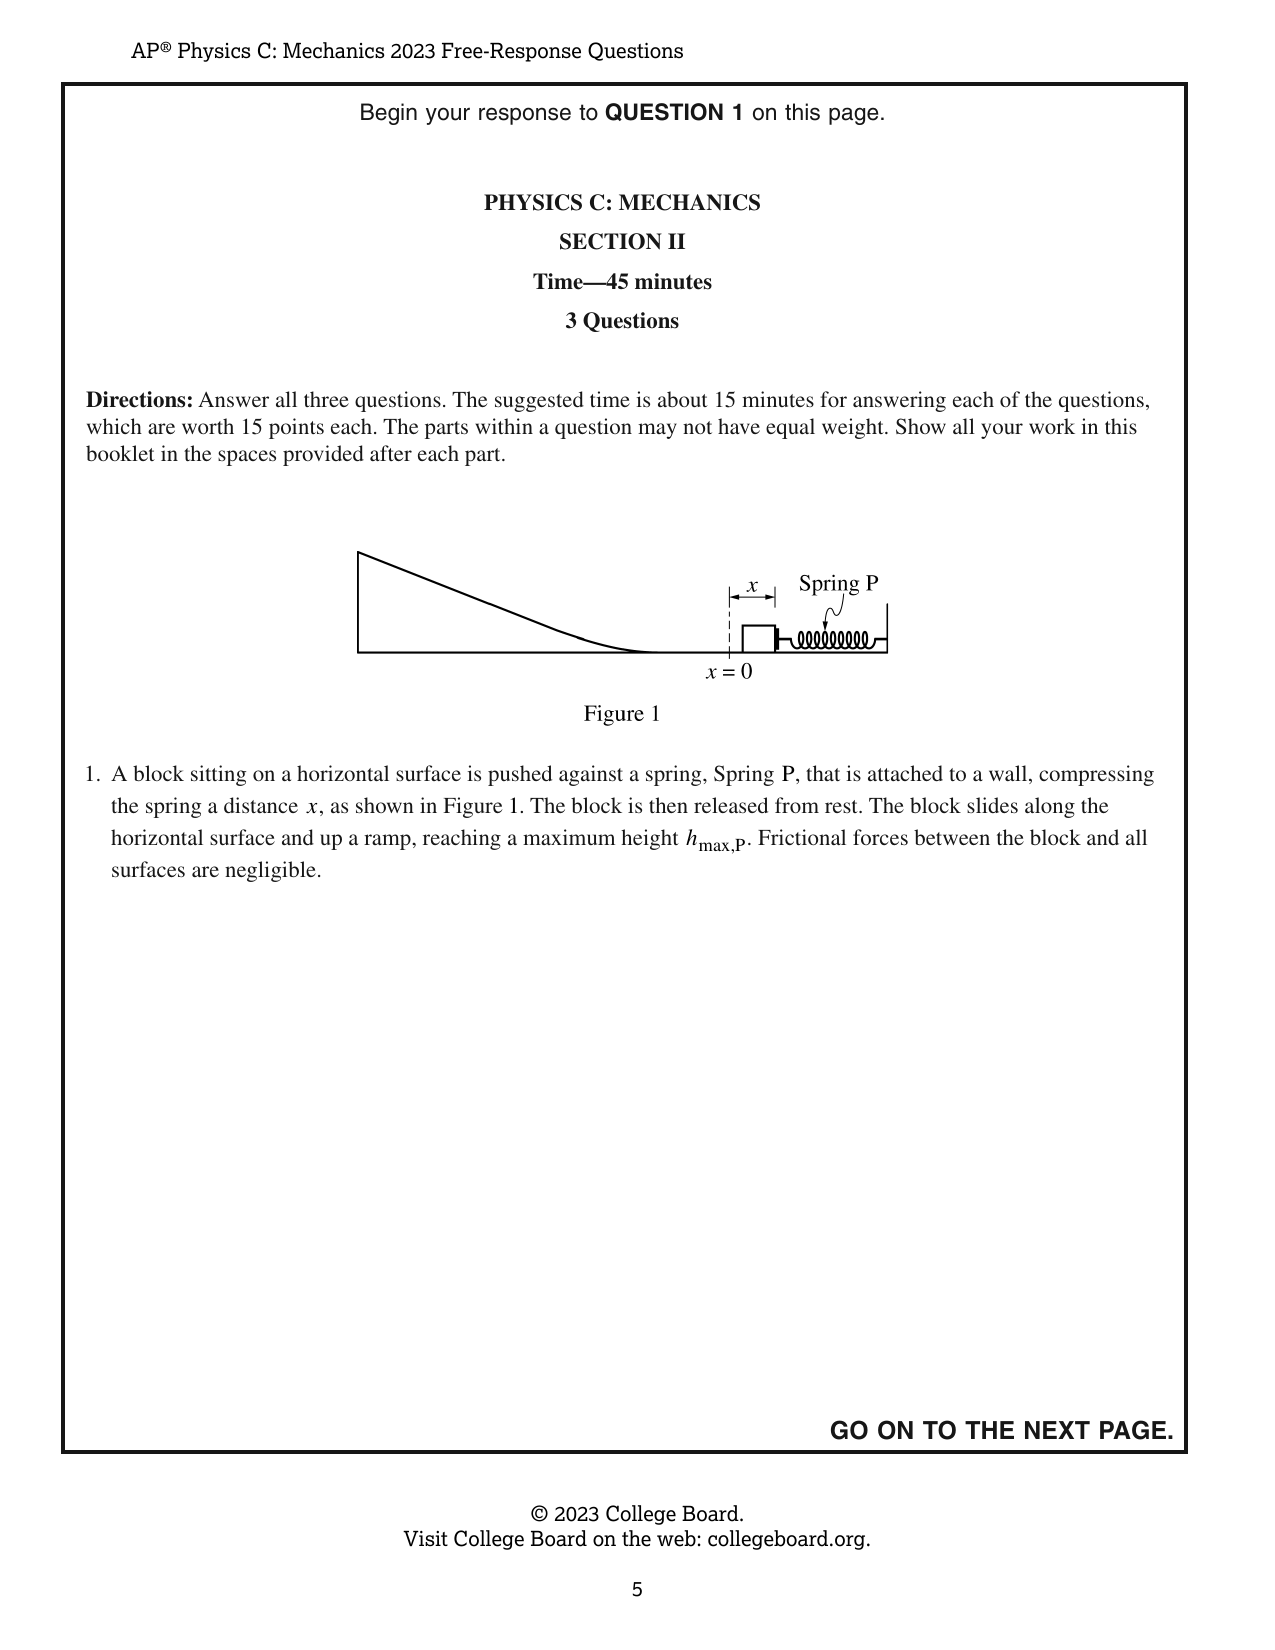
Directions: Answer all three questions. The suggested time is about 15 minutes for answering each of the questions, which are worth 15 points each. The parts within a question may not have equal weight. Show all your work in this booklet in the spaces provided after each part. 1. A block sitting on a horizontal surface is pushed against a spring, Spring P, that is attached to a wall, compressing the spring a distance x, as shown in Figure 1. The block is then released from rest. The block slides along the horizontal surface and up a ramp, reaching a maximum height h_max,P. Frictional forces between the block and all surfaces are negligible. A student compares h_max,P for Spring P with the maximum height h_max,Q achieved with a different spring, Spring Q. Each spring exerts a force of magnitude F on the block that varies as a function of the distance x that the spring is compressed, as shown in Figure 2. For Spring P, F_P(x) = kx, where k = 100.0 N/m, and for Spring Q, F_Q(x) = Cx^{1/2}, where C = 20.0 N/m^{1/2}. (a) For the experiment, the block is pushed against one of the springs, compressing the spring a distance x = 0.010 m. The block is then released from rest. In Trial 1, Spring P is used, and in Trial 2, Spring Q is used. On the following dots, representing the block in Trials 1 and 2, draw and label the forces (not components) that are exerted on the block at the instant the block is released. Each force must be represented by a distinct arrow starting on, and pointing away from, the dot. The lengths of the horizontal vectors should represent the relative magnitude of the horizontal forces and the lengths of the vertical vectors should represent the relative magnitude of the vertical forces. Trial 1 (Spring P) Trial 2 (Spring Q) (b) i. What feature(s) of the graph in Figure 2 could be used to estimate the work done on the block by each spring as each spring is compressed? ii. There is one compression distance x_0 for which the maximum height h_max reached by the block is the same regardless of which spring, Spring P or Spring Q, is used. Predict whether the value of x_0 is greater than, less than, or equal to 0.040 m. Use the graph in Figure 2 to justify your answer. iii. On the axes provided, for both Spring P and Spring Q, sketch a graph of the maximum height h_max reached by the block as a function of the distance each spring is compressed for values of x ranging from 0 to 0.100 m. Clearly label the curve for Spring P and Spring Q. (c) Spring Q is attached to the wall and is at equilibrium, as shown in Figure 3. Block A has a mass of 0.120 kg and Block B has a mass of 0.070 kg. Block A is held at rest at the top of the ramp and Block B is at rest on the horizontal surface. The student releases Block A, and it moves down the ramp and collides with Block B. The change in vertical height of Block A is H = 0.75 m. After the collision, the blocks stick together and move to the right, compressing the spring. Frictional forces between the blocks and all surfaces are negligible. i. Calculate the velocity of the two-block system immediately after the collision between Blocks A and B. ii. Calculate the maximum compression of the spring. (d) Spring Q where F_Q(x) = Cx^{1/2} is replaced by a different nonlinear spring, Spring R, and the procedure described in part (c) is repeated. For Spring R, F_R(x) = Dx^{1/2}. The maximum compression of Spring R is greater than the maximum compression of Spring Q. Which of the following correctly compares the constants C and D? ___ C < D ___ C > D ___ C = D Briefly justify your answer. © 2023 College Board. Visit College Board on the web: collegeboard.org.
Rubric Criteria (15)
C1The response correctly draws and labels the force of gravity and the normal force on both dots. Appropriate labels for the force due to gravity include FG, Fg, Fgrav, W, mg, Mg, “grav force”, “F Earth on block”, “F on block by Earth”, FEarth on block, or FE,Block; labels G and g are not appropriate. Appropriate labels for the normal force include Fn, FN, N, “normal force”, “ground force”, or similar. A response that includes extraneous vectors can earn a maximum of 1 point for part (a).
1.0000pts
C2The response draws and labels the spring force to the left on both dots, where the force vector for Spring Q (Trial 2) is twice as long as the force vector for Spring P (Trial 1).
1.0000pts
C3The response states that the work is equal to the area under the curve.
1.0000pts
C4The response states that the spring compression will be greater than 0.040 m with an attempt at a relevant justification.
1.0000pts
C5The response provides a justification indicating that the heights are equal when the area between each function and the horizontal axis are equal, which happens after x = 0.040 m. A mathematical solution is not required to earn this point, but a mathematical solution may be referenced.
1.0000pts
C6The response draws smooth concave upward curves for both springs P and Q.
1.0000pts
C7The response shows that the curves intersect after x = 0.05 m but before x = 0.10 m.
1.0000pts
C8The response shows the curve for Spring P below Spring Q before the intersection and the curve for Spring P above Spring Q after this intersection.
1.0000pts
C9The response correctly applies conservation of energy to solve for the velocity of Block A just before it collides with Block B.
1.0000pts
C10The response substitutes the calculated value for v_A into a correct conservation of linear momentum expression and solves for v_f.
1.0000pts
C11The response equates the kinetic energy of the two-block system and the elastic potential energy of the spring.
1.0000pts
C12The response correctly integrates to determine the elastic potential energy at the spring’s maximum compression.
1.0000pts
C13The response substitutes the value for v_f from part (c)(i) into the integrated equation and solves for x_max.
1.0000pts
C14The response selects C > D with an attempt at a relevant justification.
1.0000pts
C15The response includes either a statement that correctly relates the total energy of the system, the maximum compression distance of the spring, and the spring constant, or a statement that correctly relates the force exerted on the blocks by the spring, the maximum compression distance of the spring, and the spring constant.
1.0000pts
Dependencies (0)
Page Mapping (5)
Visual Preview
4 boxes
Draw, drag, resize. Advanced coordinates are available if needed.
1
2
3
4
Select a box to edit its role and metadata.
Attribution
This material is the intellectual property of College Board, is not owned by GradeThis, and is shown here for ease of use and demonstration purposes.